Teachers guide students to use Exploring Society India and Beyond Class 8 Solutions and Class 8 Social Science SST Part 2 Chapter 6 Dynamics of Population Question Answer NCERT Solutions for quick learning.
Dynamics of Population Class 8 Questions and Answers
Dynamics of Population Class 8 Question Answer
The Big Questions (NCERT Page No. 167)
Question 1.
What is demography?
Answer:
Demography is the study of human population and how it changes over time.
Question 2.
What are some Important concepts of demography?
Answer:
Population size, structure, composition, trends, birth rate, death rate, fertility rate, life expectancy, migration, sex ratio, age structure, etc are some important concepts of demography.
Question 3.
How has the population of India and the world changed over time?
Answer:
The population of both India and the world has increased over time. The world’s population grew from 2.5 billion in 1950 to 8.2 billion in 2025. In 2023, India surpassed China to become the world’s most populous country and now accounts for about 17% of the world’s population. Although population growth has slowed due to declining birth rates, India’s population is still growing, while countries such as China, Japan, and Italy are experiencing shrinking populations.

Question 4.
How do population trends shape societies and economies?
Answer:
Population trends have a significant impact on societies and economies. A large working-age population can boost economic growth by providing a bigger workforce, known as the demographic dividend.
On the other hand, a declining birth rate and an ageing population can increase the burden on the working population and create challenges in providing healthcare and social security. Population trends also influence the demand for education, healthcare, housing, employment and other public services.
Class 8 Dynamics of Population Question Answer
Let’s Explore (NCERT Page No. 172)
Question 1.
Ask your family members ¡f they have observed any of the following changes around them over the years. Farmland or green spaces being turned into new buildings for housing. More crowded streets, more cars and buses, and traffic congestion in public spaces. Changing types of homes (e.g., smaller apartments, more single-family homes). What could be the possible reasons behind these changes?
Answer:
The possible reasons behind these changes are as follows
- Farmland and green spaces are being converted into buildings because the population is increasing and more
houses are needed. - Streets are becoming more crowded with more vehicles because more people are moving to towns and cities, and the number of private vehicles has increased.
- Types of homes are changing because land is limited and expensive, families are becoming smaller, and more people prefer apartments in urban areas.
Let’s Explore (NCERT Page No. 173)
Question 2.
Why is the replacement rate 2.1 and not 2 (parents get replaced by children)? What are the situations in which
the replacement rate can be higher?
Answer:
- The replacement rate is 2.1 and not 2 because some children die before reaching adulthood, and some people do not have children, so a little extra is needed to replace both parents.
- The replacement rate can be higher in places where child mortality is high, healthcare facilities are poor, nutrition is weak, and living conditions are difficult.
Let’s Explore (NCERT Page No. 175 – 176)
Question 3.
Observe fertility and literacy rates in select Indian states. Do you find a relationship between the two Indicators? Prepare a report on your observations and possible reasons for the same.
| State/UT | Fertility rate | Literacy rate among women (%) |
| Bihar | 3.0 | 55 |
| Uttar Pradesh | 2.4 | 66.1 |
| Jharkhand | 2.3 | 61.7 |
| Karnataka | 1.7 | 73.4 |
| Punjab | 1.6 | 79.4 |
| Delhi | 1.6 | 83.7 |
Answer:
Yes, there is a clear inverse relationship between the two indicators.
- States with higher literacy among women have lower fertility rates. Karnataka, Punjab, and Delhi show higher
literacy among women and lower fertility. - States with lower literacy among women have higher fertility rates. Bihar, Uttar Pradesh, and Jharkhand have
lower literacy among women and higher fertility rates.
Possible reasons for it are as follows
- Educated women tend to marry later, which reduces the number of childbearing years.
- Higher literacy leads to better awareness of family planning and contraception.
- Educated families prefer smaller families to provide better education and healthcare to each child.
- Higher literacy is linked to better job opportunities for women, which encourages delayed and planned childbirth.
- States with higher literacy also have better healthcare access, lowering the need for larger families.
Let’s Explore (NCERT Page No. 180)
Question 4.
Census figures of 2001 as well as 2011 show the overall number of females per 1,000 males being much less than 1,000. Some states, however, had over 1,000 or near 1,000 (Kerala, Puducherry and Tamil Nadu). What might be the reasons for this?
Answer:
Some states have higher female ratios due to the following reasons
- Women receive better healthcare and education.
- Female literacy is higher, and gender discrimination is lower in these states.
- This leads to lower female mortality and better survival of girls.
- Examples include Kerala, Puducherry and Tamil Nadu.
Think About It (NCERT Page No. 177)
Question 1.
If many young people migrate from villages or smaller towns to cities, what changes could take place in their native villages?
Answer:
When many young people migrate to cities, villages may face the following problems
- Villages may face a shortage of working-age people.
- Farming and local work may decline due to fewer workers.
- The village population may consist mainly of elderly people and children.
- The local economy can become weaker over time.
Think About It (NCERT Page No. 183)
Question 2.
If the replacement rate is less than 2, what will the population pyramid look like? Will there ever be a situation where the number of children is less than the number of aged people? What is likely to happen to the population of such a country over time?
Answer:
If the replacement rate is less than 2, fewer children are born each year. The population pyramid will have a narrow base and a wider top. Over time, the number of elderly people can become more than children. Such a country may also face a shortage of workers, slower economic growth, and increased demand for healthcare and pension services.
Think About It (NCERT Page No. 186)
Question 3.
Indian society has had the concept of ashrama dharma, where life is divided into four phases: brahmacharya,
grihastha ashrama, vanaprasta and sanyasa. Though older people begin to withdraw from economic activities, they continue to play other important roles, share their knowledge and wisdom with family and society as needed. Cultural continuity becomes possible through their guidance in rituals, storytelling, etc. They hold knowledge that may not necessarily be in books. Can you think of all the ways in which older people in your neighbourhood contribute to their family and society?
Answer:
The ways in which older people in my neighbourhood contribute to their family and society are as follows
- Older people share their knowledge and life experiences with younger family members.
- They help in childcare and guide families in traditions and values.
- They support community activities and social harmony.
- Their stories and advice help preserve culture and continuity in society.
Class 8 SST Part 2 Chapter 6 Question Answer
Questions and Activities (NCERT Page No. 187)
Question 1.
Why Is It important for a country to study its population through demography?
Answer:
It is important for a country to study its population through demography due to the following reasons
- Helps governments understand population size, growth, age structure, and distribution.
- Supports planning for schools, hospitals, housing and transport.
- Aids in making policies for employment, health, and social welfare.
- Helps predict future needs through population projections.
- Assists in managing resources and economic development.
Question 2.
How can a low fertility rate affect a country’s future economy and workforce?
Answer:
A low fertility rate can affect a country’s future economy and workforce in the following ways
- It reduces the number of young people entering the workforce in the future.
- It leads to labour shortages in industries and services.
- It increases the proportion of elderly people, raising healthcare and pension costs.
- Slows economic growth due to fewer working-age people.
- It can increase the tax burden on the working population.
Question 3.
Do you think a high birth rate is always good for a country? Why or why not?
Answer:
No, a high birth rate is not always good for a country due to the following reasons
- It can put pressure on food and housing. Healthcare, education, and other resources.
- It may lead to unemployment and poverty if enough jobs are not available.
- Rapid population growth can reduce the quality of Life and slow economic development.
- A balanced birth rate is better, as it supports sustainable population growth and development.
Question 4.
Do you think it’s better to have more people or fewer people in a country? What are the challenges countries face in the case of a fast-growing or shrinking population?
Answer:
It is better for a country to have a balanced population rather than too many or too few people. A balanced population has more working-age people and fewer dependents, which supports development.
Challenges of a fast-growing population are as follows
- A fast-growing population puts pressure on schools, hospitals, housing and transport facilities.
- It leads to unemployment and underemployment due to lack of sufficient jobs.
- It increases poverty and shortage of food, water and other resources.
Challenges of a shrinking population are as follows
- A shrinking population leads to a shortage of workers in the economy.
- It results in an ageing population that needs more healthcare and support.
- It increases the burden on the working population to support the elderly.
Question 5.
How does the age structure of a country affect the kind of Jobs and services it needs? Explain with examples.
Answer:
The age structure of a country affects the types of jobs and services in the following ways
- Countries with more young people, such as India, need more schools, colleges, teachers, and job opportunities for youth.
- Countries with more elderly people, such as Japan, need more hospitals, doctors, pension systems, and old-age
care services. - Countries with a large working-age population need more jobs, skill development centres and vocational training to support employment.
Question 6.
Why do you think families are generally getting smaller? Does having fewer children ensure better education and health for them? How does it affect families and society?
Answer:
Families are getting smaller due to better education, urban lifestyles, higher living costs, and awareness of family planning. Having fewer children helps parents spend more time and money on each child’s education and health. This improves the quality of life for families and creates a healthier, better-educated society. However, very low birth rates in the long run can lead to an ageing population and labour shortages.
Question 7.
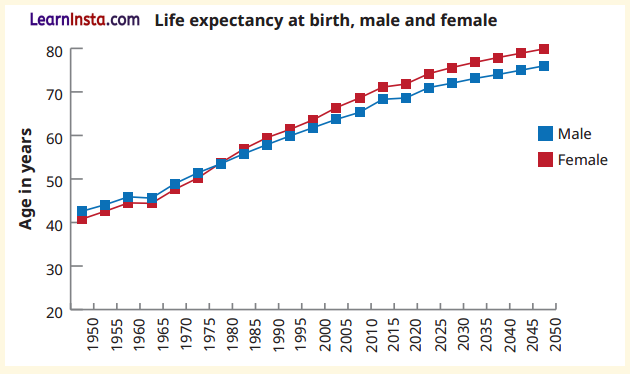
Observe the graph below showing changes in life expectancy across gender In India and answer the questions given below.
(a) Has the life expectancy in India increased? If yes, what could be the reasons?
(b) What was the life expectancy of males and females in 2010?
Answer:
(a) Yes, life expectancy in India has increased over time. This increase is due to better medical facilities, vaccination, and availability of medicines. Improved sanitation, clean drinking water, and better nutrition have also reduced death rates.
(b) In 2010, the life expectancy of males in India was about 68 years. In 2010, the life expectancy of females in India was about 72 years.
Question 8.
What is a demographic dividend and how does it benefit a country? What do you think India needs to do today to make the most of its demographic dividend before 2050?
Answer:
Demographic dividend is the economic growth potential that arises when a country has a large working-age population compared to the dependent population.
Benefits of demographic dividend are given as following
- It provides a large workforce that can increase productivity and economic growth.
- More working people earn income, pay taxes, and contribute to national development.
- It increases investment in infrastructure and improves living standards.
To make the most of its demographic dividend before 2050, India should take the following measures
- Invest in quality education, skill training and healthcare facilities.
- Create more employment opportunities.
- Encourage greater participation of women in the workforce.
- Strengthen childcare facilities and supportive family policies.
Question 9.
Choose two countries (for example: India and Japan, or Nigeria and Italy). Find out their.
Population size
Fertility rate
Age distribution
Life expectancy
How are they different? What might be the reasons behind these differences? For instance, find out how countries with ageing populations are managing this.
Answer:
- Population Size: India has a very large population, while Japan has a much smaller population.
- Fertility Rate: India has a moderate fertility rate, whereas Japan has a very low fertility rate.
- Life Expectancy: It is lower in India and much higher in Japan.
- Age Distribution: India has a younger population with many people in the working-age group, while Japan has
a large elderly population.
The differences are mainly due to lower birth rates and longer life expectancy in Japan, and historically higher
birth rates in India. Countries with ageing populations improve elderly healthcare and pensions, encourage older people to work longer, and use technology to reduce labour shortages.
Question 10.
Imagine you are a researcher who intends to study migration patterns in your locality. Make a questionnaire to collect data on the following questions.
Age of the person
Name of the person
Place of residence
Occupation of the person
Number of years lived in the place
List the factors contributing to migration, such as lack of facilities, poor infrastructure, limited job opportunities, and so on.
Answer:
The questionnaire to study migration patterns in the locality is as follows
- What is the name of the person?
- What is the age of the person?
- What is the occupation of the person?
- What is the present place of residence?
- How many years has the person lived in this place?
- What was the previous place of residence?
- What were the main reasons for migration, such as lack of facilities, poor infrastructure, or limited job opportunities?
- What problems were faced in the earlier place of residence?
- Has migration improved the person’s living conditions?
Question 11.
Draw a population pyramid on graph paper for India using the data given in the following table.
Age-group-wise percentage distribution of population (2021)
| Age Group | Male | Female |
| 0 – 4 | 8.6 | 8.2 |
| 5 – 9 | 8.9 | 8.4 |
| 10 – 14 | 8.7 | 8.6 |
| 15 – 19 | 9.3 | 9 |
| 20 – 24 | 9.5 | 9.1 |
| 25 – 29 | 9 | 8.6 |
| 30 – 34 | 8.1 | 8 |
| 35 – 39 | 7.1 | 7.4 |
| 40 – 44 | 6.3 | 6.7 |
| 45 – 49 | 5.7 | 6 |
| 50 – 54 | 5 | 5.2 |
| 55 – 59 | 4.2 | 4.2 |
| 60 – 64 | 3.2 | 3.3 |
| 65 – 69 | 2.4 | 2.7 |
| 70 – 74 | 1.8 | 2.1 |
| 75 – 79 | 1.2 | 1.4 |
| 80+ | 0.9 | 1.2 |
Answer:

Question 12.
Observe the population pyramid for Japan in 2023 below. What can you infer from this? Write your observations and share in the class.

Answer:
Observations from the population pyramid of Japan (2023) are as follows
- The population pyramid of Japan shows a narrow base, which indicates a low birth rate.
- The upper part of the pyramid is wider, which shows a large elderly population.
- The working-age population is shrinking over time.
- This situation increases pressure on healthcare services and pension systems.