Experts have designed these Class 8 Social Science Notes and Class 8 SST Part 2 Chapter 6 Dynamics of Population Notes for effective learning.
Class 8 Dynamics of Population Notes
Dynamics of Population Notes Class 8
→ Ageing population: A situation where there are more elderly people who need care and fewer young people working to support them.
→ Birth rate: The number of live human births per 1,000 population in a year.
→ Census: The official count of people living in a country in a particular period.
→ Child mortality: The number of deaths of children under 5 years of age per 1,000 live births.
→ Death rate (Mortality rate): The number of deaths in a population during a year, typically expressed as deaths per 1,000 people.
→ Demographic dividend: The economic growth potential of a nation resulting from a younger and productive age structure.
→ Demographic Transition: A sequence of stages characterised by different combinations of birth and death rates which affect a country’s population size.
→ Demography: The statistical study of the composition of human population including factors like age, sex, occupation, and religion, and how they change over time.
→ Double burden: The challenge faced by women who manage both formal job responsibilities and household duties.
→ Fertility rate: The average number of children a woman would have in her lifetime.
→ Gender balance: The equal or equitable representation of males and females within a population.
→ Human capital: The development of people through education, employment, and healthcare to boost a country’s growth.
→ Indicator: A measure used to gauge or monitor, show or track a specific condition, such as birth or death rates.
→ Influx: The arrival or entry of a large number of people into a particular area.
→ Kinship networks: Web of social relationships through blood, marriage, and adoption.
→ Life expectancy: The average number of years a newborn is expected to live if they grow up with the same health and safety conditions present today.

→ Median Age: The age that divides a population into two numerically equal groups; half the people are older and half are younger.
→ Migration: The movement of people from one place to another to settle temporarily or permanently.
→ Pension: A regular payment made by the state or an employer to people of or above the official retirement age.
→ Population Composition: The specific characteristics of the overall population, including age, gender, occupation, and education.
→ Population Size: The total number of people living in a specific region or country.
→ Population structure diagram (Population Pyramid): A special kind of graph that shows the number of people in a country by age groups and gender.
→ Productivity: A measure of performance regarding the amount of goods and services produced with a given quantity of resources.
→ Projection: An estimate or prediction of a future situations based on a study of present trends.
→ Replacement level fertility rate: A fertility rate of 2.1, which is the number of children needed to replace the parents in the population to maintain stability.
→ Sex ratio: Represents the number of females per 1,000 males in the population.
→ Stagnant: Showing no activity or growth; a population that is not increasing or decreasing.
→ Structure of Population: Explains the way a population is made up based on different characteristics such as age, gender, education, etc.
→ Taxes: Mandatory fees paid by individuals and businesses to the government to fund public services like roads, schools and healthcare.
→ United Nations: An intergovernmental organisation involved in global study and study of population trends.
→ Working-age population: The group of people between the ages of 15 and 64 years who are generally considered the most productive in terms of economic output.
→ Youth bulge: A phenomenon where a large portion of the population comprises children and young adults (typically 16-30 years).
Introduction

- Population is one of the most important factors in understanding the development of a country because people are the real strength of every nation.
- The study of population helps us understand how many people live in a place, where they live, and how their numbers change over time.
- Population affects the economy, society and environment of a country in many different ways.
- Governments need correct information about population so that they can plan for education, healthcare, housing and employment.
- Population changes continuously due to births, deaths and migration.
- A large population can become a valuable resource when people are educated, skilled and healthy.
- Rapid population growth can create pressure on resources like land, food, water and public services.
- Therefore, the study of population is important for proper planning and balanced development.
What is Demography?
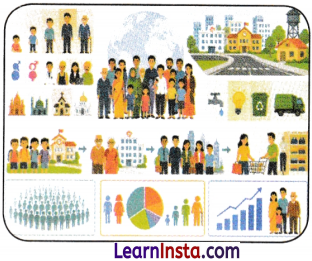
- Demography is the study of the composition of human population in terms of factors such as age, sex, occupation, and religion, and how they change over time.
- It helps us better understand the people living in a region.
- Governments use this information to plan infrastructure, such as schools, hospitals, roads, and housing.
- It also aids in planning municipal services like water supply, energy, waste management, etc.
- For example, if a place has many young children, more schools are needed; if the proportion of the elderly is higher, more healthcare facilities are required.
- A higher share of young working-age population implies a greater need for employment opportunities.
- Businesses also assess their potential customers based on characteristics like age, gender, and income to design products that meet people’s needs.
- Determining a country’s population size and structure helps in better allocation and management of resources.
- The three main components of demography are size, structure and composition, and patterns and trends.
The Census:
- The census is conducted to count the total number of people living in the country during a specific period. In India, it usually takes place once every ten years.
- The process helps the government understand the overall population and its different characteristics.
- Data is collected by gathering detailed information directly from individual citizens. The collected details include personal data such as age, gender, marital status, and family size.
- It also records social and economic factors like education levels, languages spoken, religion, occupation, employment status, and income.
Population at a Glance
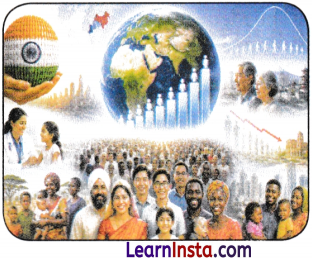
- In 2023, India surpassed China to become the world’s most populous country.
- Indians currently constitute around 17 per cent of the world’s population.
- The world population grew from 2.5 billion in 1950 to 8.2 billion in 2025 and it is expected to reach 9.7 billion by 2050.
- Improved healthcare enabled individuals to live longer, which largely explains this growth trajectory.
- As per the United Nations projections, the population will peak at 10.3 billion by the mid-2080s and then gradually decline as birth rates fall.
- Population growth varies across nations — countries like China. Japan, and Italy are already seeing shrinking populations while India’s is growing for now.
- Several African nations, such as Ethiopia and Nigeria, are witnessing rapid population growth.
Growth And Distribution of World Population:
- The global population started growing at a very quick pace from the 1950s onward.
- This rapid growth happened because of major developments in the field of medicine, such as the introduction of vaccines, antibiotics, and oral rehydration solutions.
- The availability of clean drinking water and improved sanitation systems reached a larger number of people during this time.
- These health advancements successfully lowered the number of child deaths caused by diseases like malaria and diarrhea.
- Financial growth and economic wealth began to benefit a wider population across many nations in this era.
- The distribution of the global population across different regions shows significant variations.
- Asia holds the largest share of the population with 4.8 billion people, followed by Africa with 1.5 billion people.
- Europe has a population of 744.3 million, while Northern America stands at 387.5 million.
- Latin America and the Caribbean have a population of 66.78 million, and Australia and Oceania have the smallest population at 46.6 million.
What Determines the Population of a Country?
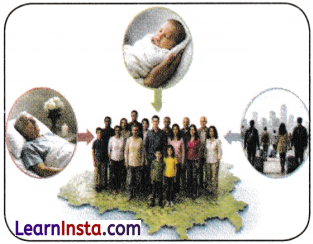
- The population of a country at any given time is shaped by three main factors— how many babies are bom, how many people die, and how many people move in and out of the country.
- These gradual changes over the years combine to determine the current size and structure of the population.
→ Birth and Fertility Rates
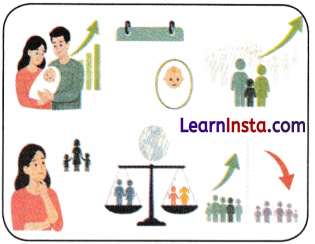
- The birth rate shows how quickly new members are being added to a population, helping us understand its pace of growth.
- It measures the number of individuals bom during a specified period, usually stated as the total number of live human births per 1,000 in a year.
- If many babies are being bom, the birth rate is high, and the population grows faster.
- The fertility rate is the average number of children a woman would have in her lifetime.
- A fertility rate of 2.1 is often called the ‘replacement level fertility rate’ because it is the number of children needed to replace the parents in the population.
- If the fertility rate is above 2.1, the population is likely to grow; if it is below 2.1, the population might shrink over time.
- India also launched population control initiatives starting in 1952, using famous public campaigns like ‘Hum do humare do’ to encourage smaller families.
- India’s fertility rate decreased from 5.7 in 1950 to 1.9 in 2025, though its total population is still growing.
- Low fertility rates are now a common trend across many developed nations, including Japan, South Korea, Singapore, Taiwan, Italy, Spain, and France.
- Improvements in access to quality education, especially for girls, have been an important factor in reducing fertility.
- As women receive formal education and enter the workforce, they tend to marry later and have fewer children.
- With rapid urbanisation, the cost of living particularly in cities has risen, leading many families to prefer having fewer children.
China’s One Child Policy:
- In the 1970s, the Chinese government feared that rapid population growth would result in severe shortages of food, housing, and employment.
- To address this issue, China introduced the One-Child Policy in 1979, punishing violators with job losses or financial fines.
- Following the policy, China’s fertility rate dropped significantly from 7.5 in 1963 to 1 in 2025.
- China’s total population reached its highest point at 1.43 billion in 2022 and has since started to decline, with a projected drop to 1.31 billion by 2050.
- Better medical care has increased life expectancy in China, meaning the population of elderly people (over 65 years) is expected to rise from 14 percent in 2023 to 26 percent in 2050.
- A larger retired population combined with fewer young workers could slow down China’s overall economic progress.
- The policy created a unique social structure where an entire generation grew up without siblings or extended family networks.
- Even though China ended the policy in 2015 and currently permits up to three children, the fertility rate has remained low.
→ Death or Mortality Rate

- The death or mortality rate serves as a key indicator to measure population growth.
- A lower mortality rate reflects the availability of quality healthcare system and improved nutrition.
- Child mortality is the number of deaths of children under 5 years of age per live births.
- India significantly reduced child mortality from 271 per 1,000 in 1950 to 28 in 2023.
The life expectancy at birth in India has risen from just 30 years at independence to 70 years in 2024.
Life expectancy refers to the average number of years a newborn is expected to live if current health, safety, and living conditions remain unchanged.
→ Migration
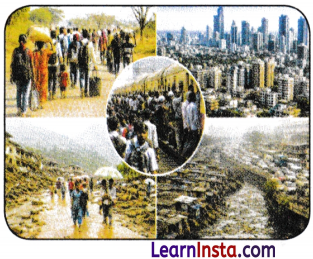
Migration refers to the movement of people from one place to another, either temporarily or permanently.
People often migrate in search of better employment opportunities, education, and improved living conditions.
Natural disasters and political instability can also force people to move away from their homes.
Regions that receive a continuous arrival of migrants, such as the cities of Delhi, Mumbai, and Bengaluru, experience a rise in population over time.
However, concentration of a very large population in a limited area can put extreme pressure on natural resources like water, air, and land.
How Do Countries Experience Population Change?
Populations go through transitions influenced by economic development, improved healthcare, education, and greater participation of women in decision-making.
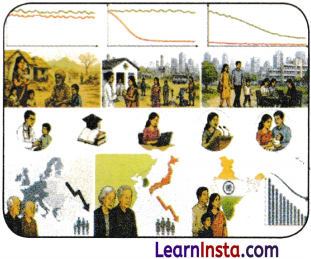
These transitions are explained through a sequence of three stages:
- Stage 1: In this phase, both birth rates and death rates are very high, which make total population growth very slow or stationary.
India experienced this stage between 1901-1921 because citizens lacked adequate healthcare facilities and suffered from low literary levels. - Stage 2: Fall in death rate due to better healthcare, but high birth rate, causing rapid population growth. In India, the population grew rapidly after 1951.
- Stage 3: On this stage, death rates stay low while birth rates finally drop due to growing urban development, higher earnings, and better school access.
- Increased participation of women in the workforce and their choice to have fewer children further reduces global population growth.
- If birth rates drop very sharply, the population begins to contract, which is currently happening in several European and East Asian nations like Italy, Japan, and South Korea.
- In India, birth rates started a continuous decline after the mid-1980s and have dropped below the baseline replacement level today.
→ India’s Population: Composition and Trends
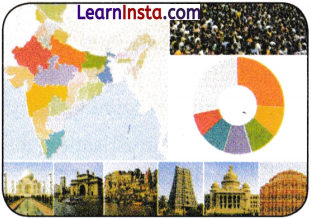
- India is divided into 28 states and is one of the most populous countries in the world.
- Population distribution across states includes Uttar Pradesh (16%), Maharashtra (9%), Bihar (9%), West Bengal (8%), Madhya Pradesh (6%), Tamil Nadu (6%), and Rajasthan (6%).
- A population structure diagram (population pyramid) shows the number of people in a country by age groups and gender.
- A wide base indicates many children and a young, growing population; a widest middle stable population; and a wide top reflects an ageing population.
- In the 1950s, India’s population pyramid was like a narrow triangle.
- In recent years, the shape of India’s population pyramid has transformed from a traditional triangle into a bell-shaped structure.
- The bottom base of the pyramid has become narrower because families are choosing to have fewer children than in the past.
- The middle section of the pyramid has expanded significantly, indicating a very large population of citizens in the working-age category between 15 and 60 years.
- This large group of working-age individuals is known as India’s demographic dividend, which provides a massive workforce to help the economy expand.
- The upper peak of the pyramid is slowly widening because improved nutrition, better healthcare, and safer living conditions allow people to live longer lives.
- Overall, these structural changes show that India has transitioned away from a young, rapidly growing population toward a more balanced one.
In the coming decades, the population structure is expected to age slowly, following a trend that is already visible in nations like Japan and China.
Improvement in India’s sex Ratio:
- Sex ratio represents the number of females per 1,000 males.
- The sex ratio is important because it directly reflects a nation’s underlying cultural, social and economic conditions.
- According to the official data from Census 2001, India’s sex ratio was 933 in 2001 which later improved to 943 in 2011.
India’s Demographic Dividend – A Limited Window
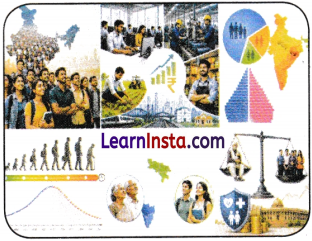
- At stage 2 of demographic transition, countries tend to have a large young population (16-30 years) which is commonly termed as the youth bulge.
- Nearly 65 per cent of the Indian population is in the working-age group of 15-59 years, and almost 27 percent is below the age of 15 years.
- A large workforce allows more citizens to work in offices, factories, farms or start businesses.
- Working citizens earn an income and pay taxes, which gives the government resources to build infrastructure like schools and hospitals etc.
- The demographic dividend refers to the economic growth potential that arises from having a younger and more productive age structure.
- India’s median age is 28 years, compared to China (40), Germany (47), Italy (48), and Japan (50).
- This window of opportunity is limited, as the growth in the young population is expected to decrease beyond 2050.
- States like Kerala and Tamil Nadu are experiencing significant population ageing, while states like Bihar and Uttar Pradesh still have relatively younger populations.
- Ageing populations put pressure on healthcare systems and make it challenging for governments to provide services like pensions, since there are fewer young taxpayers to support elderly.
Challenges in Society
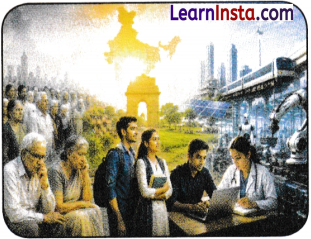
- Developed nations are taking active measures to prepare for this shift; for example, Japan has raised retirement ages and introduced automated technology to manage worker shortages.
- For developing countries, the main task is to invest heavily in education, healthcare, and job training to maximize the benefits of their demographic dividend while it lasts.
- As women enter the formal workforce, they often face a double burden of managing employment alongside traditional household duties.
- To support working women and sustain the economy, nations must develop better childcare infrastructure, flexible work hours, and community daycare centres.