Practicing Class 8 Social Science MCQ and Class 8 SST Part 2 Chapter 6 Dynamics of Population MCQ Online Test with Answers daily helps in time management.
Class 8 Dynamics of Population MCQ with Answers
MCQ on Dynamics of Population Class 8
Dynamics of Population MCQ Class 8
Question 1.
Demography mainly deals with all of the following except
(a) Fertility and mortality patterns
(b) Population distribution and migration
(c) Population size and composition
(d) Per capita income and national output
Answer:
(d) Per capita income and national output
Question 2.
What is the factor that causes population change?
(a) Trade
(b) Births, deaths and migration
(c) Literacy rate
(d) Urban planning
Answer:
(b) Births, deaths and migration
Question 3.
How frequently is a census conducted in India?
(a) Every 5 years
(b) Every 8 years
(c) Every 10 years
(d) Every 15 years
Answer:
(c) Every 10 years
Question 4.
Which organisation is responsible for estimating future world population growth?
(a) United Nations
(b) World Bank
(c) UNESCO
(d) WHO
Answer:
(a) United Nations
Question 5.
Identify the country that became the most populous in 2023, surpassing China.
(a) India
(b) Nigeria
(c) USA
(d) Indonesia
Answer:
(a) India

Question 6.
What medical advancement helped reduce deaths from diarrhoea?
(a) Vaccines
(b) Antibiotics
(c) Oral rehydration solution
(d) Surgery
Answer:
(c) Oral rehydration solution
Question 7.
State the fertility rate needed to maintain a stable population.
(a) 1.1
(b) 1.9
(c) 2.1
(d) 3.5
Answer:
(c) 2.1
Question 8.
Name the policy launched in 1979 to control population growth.
(a) Two-child policy
(b) Green Revolution
(c) One-Child Policy
(d) Family planning scheme
Answer:
(c) One-Child Policy
Question 9.
Which country has a wide top ¡n its population pyramid, reflecting an ageing population?
(a) India
(b) Nigeria
(c) Japan
(d) Ethiopia
Answer:
(c) Japan
Question 10.
What does life expectancy mean?
(a) Total population of a country
(b) Average number of years a newborn is expected to live
(c) Number of elderly people
(d) Number of deaths per year
Answer:
(b) Average number of years a newborn is expected to live
Question 11.
In the demographic transition, the stage where death rates fall but birth rates remain high is
(a) Stage 1
(b) Stage 2
(c) Stage 3
(d) Stage 4
Answer:
(b) Stage 2
Question 12.
Among Indian states, which ones are experiencing significant population ageing?
(a) Bihar and Uttar Pradesh
(b) Assam and Odisha
(c) Kerala and Tamil Nadu
(d) Rajasthan and Madhya Pradesh
Answer:
(c) Kerala and Tamil Nadu
Dynamics of Population Class 8 Assertion and Reason Questions
Question 1.
Assertion (A) Demography helps governments plan schools and hospitals.
Reason (R) Population data shows how many children and elderly people live in an area.
Codes
(a) Both A and R are true, and R is the correct explanation of A.
(b) Both A and R are true, but R is not the correct explanation of A.
(c) A is true, but R is false.
(d) A is false, but R is true.
Answer:
(a) Both A and R are true, and R is the correct explanation of A.
Question 2.
Assertion (A) Migration contributes to the growth of cities.
Reason (R) People move to cities for better jobs and education.
Codes
(a) Both A and R are true, and R is the correct explanation of A.
(b) Both A and R are true, but R is not the correct explanation of A.
(c) A is true, but R is false.
(d) A is false, but R is true.
Answer:
(a) Both A and R are true, and R is the correct explanation of A.
Question 3.
Assertion (A) Countries with ageing populations face pressure on healthcare systems.
Reason (R) Elderly people require more medical care and support services.
Codes
(a) Both A and R are true, and R is the correct explanation of A.
(b) Both A and R are true, but R is not the correct explanation of A.
(c) A is true, but R is false.
(d) A is false, but R is true.
Answer:
(a) Both A and R are true, and R is the correct explanation of A.
Question 4.
Assertion (A) Fertility rate and birth rate mean the same thing.
Reason (R) Both measure population growth in the same way.
Codes
(a) Both A and R are true, and R is the correct explanation of A.
(b) Both A and R are true, but R is not the correct explanation of A.
(c) A is true, but R is false.
(d) A is false, but R is true.
Answer:
(d) A is false, but R is true.
Question 5.
Assertion (A) The demographic dividend can boost economic growth.
Reason (R) A large working-age population increases production and tax revenue.
Codes
(a) Both A and R are true, and R is the correct explanation of A.
(b) Both A and R are true, but R is not the correct explanation of A.
(c) A is true, but R is false.
(d) A is false, but R is true.
Answer:
(a) Both A and R are true, and R is the correct explanation of A.
Dynamics of Population Class 8 Fill in the Blanks
1. The movement of people from one place to another is called ………………………. .
Answer:
migration
2. The average number of children a woman has in her lifetime is called ………………………. rate.
Answer:
fertility
3. The number of birth per 1,000 people in a year is called ……………………… rate.
Answer:
birth rate
4. The economic benefit from a large working-age population is called ………………………. .
Answer:
demographic dividend
5. India surpassed China to become the most populous country in the world in ………………………… .
Answer:
2023
6. The proportion of elderly people in a population is increasing due to population ……………………….. .
Answer:
ageing
Dynamics of Population Class 8 True or False
1. Life expectancy has increased due to better healthcare and sanitation.
Answer:
True
2. Migration does not affect housing, water, or transport in cities like Delhi, Mumbai and Bengaluru.
Answer:
False
3. A low birth rate combined with a fertility rate below replacement level leads to population decline.
Answer:
True
4. Kerala, Puducherry and Tamil Nadu have better sex ratios compared to some other Indian states.
Answer:
True
5. In 1950, India’s fertility rate was 5. 2 children per woman.
Answer:
False
6. Countries with low fertility rates may face population decline.
Answer:
True
7. Developed countries like Japan support ageing populations by raising retirement age, using technology, and providing community services.
Answer:
True
Dynamics of Population Class 8 Match the Following
Question 1.
| List I (Indicator) | List II (Meaning) |
| A. Birth rate | 1. Average number of children a woman has in her lifetime |
| B. Fertility rate | 2. Number of babies born per 1,000 people in a year |
| C. Life expectancy | 3. Average number of years a newborn is expected to live |
| D. Sex ratio | 4. Number of females per 1,000 males |
Codes
A B C D
(a) 2 1 3 4
(b) 1 2 4 3
(c) 3 2 1 4
(d) 2 4 1 3
Answer:
(a) 2 1 3 4
| List I (Indicator) | List II (Meaning) |
| A. Birth rate | 2. Number of babies born per 1,000 people in a year |
| B. Fertility rate | 1. Average number of children a woman has in her lifetime |
| C. Life expectancy | 3. Average number of years a newborn is expected to live |
| D. Sex ratio | 4. Number of females per 1,000 males |
Question 2.
| List I (Concept) | List II (Notes) |
| A. Stage 1 of Demographic Transition | 1. High birth & death rates, slow population growth (India 1901-1921) |
| B. Stage 2 of Demographic Transition | 2. Falling death rate, high birth rate, rapid growth (India post-1951) |
| C. Stage 3 of Demographic Transition | 3. Low death rate, falling birth rate, slow growth (India post-mid-1980s) |
| D. Demographic Dividend | 4. Economic growth potential from a large working-age population |
Codes
ABCD
(a) 1 2 3 4
(b) 2 1 4 3
(c) 3 2 1 4
(d) 4 3 2 1
Answer:
(a) 1 2 3 4
| List I (Concept) | List II (Notes) |
| A. Stage 1 of Demographic Transition | 1. High birth & death rates, slow population growth (India 1901-1921) |
| B. Stage 2 of Demographic Transition | 2. Falling death rate, high birth rate, rapid growth (India post-1951) |
| C. Stage 3 of Demographic Transition | 3. Low death rate, falling birth rate, slow growth (India post-mid-1980s) |
| D. Demographic Dividend | 4. Economic growth potential from a large working-age population |
Dynamics of Population Class 8 Picture based Questions
Question 1.
The image given below shows a population pyramid of a country, where the base is wide and the top is narrow, indicating a large number of children and young people.
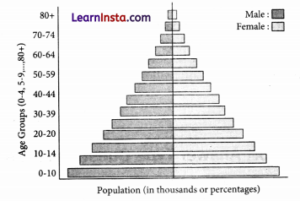
Which of the following conclusions can be best drawn from the population structure shown in the image?
(a) The country has a declining population with more elderly people.
(b) The country has a high birth rate and a growing population.
(c) The country has a stable population with equal numbers in all age groups.
(d) The country has very low fertility and high mortality.
Answer:
(b) The country has a high birth rate and a growing population.
Question 2.
The image given below shows a population pyramid of a country, where the middle age groups are very wide, and the base is narrower than before.
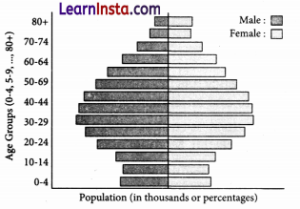
Which of the following statements best explains the advantage of this population structure?
(a) It indicates a large number of elderly people who cannot work.
(b) It shows a large working-age population, which can boost economic growth.
(c) It shows a high dependency on children for economic activities.
(d) It indicates low life expectancy and poor healthcare facilities.
Answer:
(b) It shows a large working-age population, which can boost economic growth.
Citizenship Rights and Duties Class 8 Case Based Questions
Question 1.
Read the passage given below and answer the following questions.
Nations need to prepare for the demographic transition. For developed countries, it is important to support an ageing society while maintaining productivity and innovation. For instance, Japan has raised the retirement age, and has employed technology and automation to compensate for labour shortages. There are large-scale community centres and robots and Al assistants to help care for older adults.
(i) Which strategy has been adopted by some developed nations to manage the challenges of an ageing population?
(a) Encouraging higher birth rates
(b) Using technology and automation to support older adults
(c) Reducing retirement age
(d) Limiting women’s participation in jobs
Answer:
(b) Using technology and automation to support older adults
(ii) What must developing countries focus on to fully benefit from their large working-age population?
(a) Promoting urbanisation and industrial growth
(b) Investment in education, skill development and healthcare
(c) Increasing the retirement age
(d) Limiting fertility rates
Answer:
(b) Investment in education, skill development and healthcare
(iii) Why have policies aimed at increasing fertility rates in many countries been largely unsuccessful?
(a) People are unwilling to have more children despite incentives
(b) Healthcare facilities are inadequate
(c) Education systems are weak
(d) There is too much reliance on technology
Answer:
(a) People are unwilling to have more children despite incentives