Students revise important topics using Class 8 Social Science Extra Questions and Class 8 SST Part 2 Chapter 6 Dynamics of Population Extra Question Answer before exams.
Dynamics of Population Class 8 Extra Question Answer
Extra Questions of Dynamics of Population Class 8
Dynamics of Population Class 8 Very Short Question Answer
Question 1.
How is population data collected in India?
Answer:
Population data is collected through the Census, which is conducted every 10 years.
Question 2.
How is the number of deaths in a population measured?
Answer:
The number of deaths is measured using the death rate, which shows deaths per 1,000 people.
Question 3.
What is the number of children a woman must have to replace herself and her partner?
Answer:
The number of children a woman must have to replace herself and her partner is called the replacement-level fertility rate, usually about two children per woman.
Question 4.
Which age group is considered the working-age population?
Answer:
People aged 15 to 64 years are considered the working-age population.
Question 5.
How do we measure the deaths of children under five years of age?
Answer:
It is measured by the child mortality rate, indicating deaths per 1,000 children under five.

Question 6.
How has India’s fertility rate changed since 1.950?
Answer:
India’s fertility rate has declined significantly from 5.7 children per woman in 1950 to 1.9 in 2025.
Question 7.
What does it show if the base of a population pyramid is very narrow?
Answer:
If the base of a population pyramid is very narrow, it shows that fewer children are being born and fertility is declining.
Question 8.
What is the ratio of non-working people to working-age people called?
Answer:
The ratio of non-working people to working-age people is called the dependency ratio.
Dynamics of Population Class 8 Short Question Answer
Question 1.
Why is demography Important for government planning?
Answer:
Demography is important for government planning due to the following reasons
- Governments could allocate resources such as food, water, and healthcare more efficiently to meet the needs of citizens.
- Policymakers can plan for employment generation and economic growth that matches the workforce’s size and skills.
- Helps governments design long-term policies for population control, ageing populations and migration management, ensuring sustainable development.
Question 2.
Why did rapid world population growth begin after the 1950s?
Answer:
Rapid world population growth began after the 1950s due to the following reasons
- Medical advancements, such as vaccines and antibiotics, significantly reduced death rates, especially among children.
- The availability of clean water and improved sanitation helped prevent diseases, leading to longer life expectancy.
- Better nutrition and food distribution systems ensured that more people survived childhood and lived healthier lives.
Question 3.
What changes are seen in India’s population pyramid over time?
Answer:
The changes seen in India’s population pyramid over time are as follows
- Over time, India’s population pyramid shows a narrowing base, which indicates that families are having fewer children compared to previous generations.
- The middle portion, representing the working-age population, has widened, reflecting the demographic dividend with a large number of people available for work.
- The top part of the pyramid is slowly becoming wider, showing that life expectancy is increasing and more people are living to older ages.
- Overall, the pyramid is changing from a traditional triangular shape to a more bell-like shapes indicating demographic transitions in fertility and mortality.
Question 4.
Why does an ageing population create economic challenges?
Answer:
An ageing population creates economic challenges due to the following reasons
- There are fewer working-age people to generate income and support economic growth.
- Governments need to spend more on pensions, healthcare and social welfare programmes to care for elderly citizens.
- A higher dependency ratio arises, meaning that the smaller workforce has to support a larger number of non-working elderly people.
Question 5.
What is the difference between birth rate and fertility rate? (Competency Based Questions)
Answer:
The difference between birth rate and fertility rate is as follows
| Birth Rate | Fertility Rate |
| It is the number of live births per 1,000 people in a population in a given year. | It is the average number of children a woman is expected to have during her lifetime. |
| It provides a general idea of Population growth | It helps predict long-term population trends. |
| It is calculated for the entire population. | It is calculated only for women of reproductive age. |
| It reflects population growth in a particular year. | It indicates future demographic changes over generations. |
Question 6.
How does women’s education influence family size? (Competency Based Questions)
Answer:
Women’s education influences family size in the following ways
- Educated women tend to marry later and delay starting a family, which naturally reduces the number of children.
- They are more aware of family planning methods and make informed decisions about reproduction.
- Career ambitions and employment opportunities encourage women to have smaller families.
- Smaller families also result in healthier children and better opportunities for each child’s education.
Dynamics of Population Class 8 Long Question Answer
Question 1.
Explain the components of demography and their Importance.
Answer:
Demography is the study of human populations, including their Size, structure, and trends over time.
The components of demography and their significance are as follows
- The size of the population refers to the total number of people living in a place.
- Population structure and composition include characteristics such as age, gender, education, occupation, and religion.
- Population trends show how the population changes due to births, deaths, and migration.
- The components of demography is important because it helps governments plan schools, hospitals, roads, and housing.
- It also helps in managing resources, creating jobs, and guiding businesses in understanding customers.
Question 2.
Describe the stages of demographic transition with examples from India.
Answer:
The stages of demographic transition with examples are as follows
- Stage 1 has high birth and death rates, causing very slow population growth; India experienced this between 1901 and 1921.
- Stage 2 shows falling death rates while birth rates remain high, leading to rapid growth; this occurred in India after 1951.
- Stage 3 has low death rates and declining birth rates, which slows population growth; India entered this stage after the mid- 1980s.
- Factors affecting Stage 3 include urbanisation, higher income, better education, and women working.
- If fertility falls below replacement level, the population may shrink, as seen in Italy and Japan.
Question 3.
Discuss the opportunities and challenges faced by developing countries due to population change.
Answer:
Opportunities faced by developing countries due to population change are as follows
- Developing countries can benefit from a large working-age population because it can help the country grow economically.
- A large number of young people can start businesses and bring new ideas to the country.
Challenges faced by developing countries due to population change are as follows
- Providing good education for all children is a challenge for developing countries.
- Healthcare facilities may not be enough to meet the needs of a growing population.
- Creating enough jobs for all working-age people is difficult, which can lead to unemployment.
- Women often face the double burden of work and household duties, which limits their participation in the workforce.
Question 4.
Why is the demographic dividend called a limited window of opportunity? (Competency Based Questions)
Answer:
The demographic dividend is called a limited window of opportunity due to the following reasons
- The period during which the working-age population is larger than the dependent population is temporary.
- As fertility rates decline and life expectancy increases, the population gradually ages, reducing the share of the working-age population.
- To benefit from this phase, governments must invest in quality education, skill development, healthcare and
employment opportunities. - If these investments are not made in time, the opportunity to achieve faster economic growth may be lost.
- Once the population becomes older, the country faces higher dependency ratios, greater demand for healthcare and social security, and slower economic growth.
- Thus, the demographic dividend can contribute to national development only if it is effecüvely-utilised during this limited period.
Question 5.
Explain the main factors that influence a country’s population. How do these factors help us understand changes in population?
Answer:
The main factors that influence a country’s population are as follows
- Birth Rate: Number of babies born per 1,000 people in a year. Higher birth rates increase population.
- Fertility Rate: Average number of children a woman is expected to have in her lifetime. It helps predict population growth, stability, or decline.
- Death Rate: Number of deaths per 1,000 people in a year. Lower death rates contribute to population growth, while higher rates reduce it.
- Migration: Movement of people into (immigration) or out of (emigration) a country. It changes the size, age and skill composition of the population.
These factors and their related indicators (like age structure, sex ratio, life expectancy and infant mortality) help us understand changes in population in the following ways
- Monitor whether the population is increasing, decreasing, or stable.
- Plan for resources, healthcare, education and employment.
- Understand social and economic challenges related to population changes.
Question 6.
Describe the population control measures in China and India. How have these policies affected fertility trends, population growth and society? Give examples of other countries facing low fertility rates.
Answer:
Many countries have introduced population control measures to regulate population growth. These measures have influenced fertility trends, population growth, and society in the following ways
- In China, the One Child Policy was introduced in 1979 to control rapid population growth. Families that broke the rule faced fines or lost their jobs.
- China’s fertility rate fell from 7.5 in 1963 to 1.0 in 2025; China’s population reached 1.43 billion in 2022 and is expected to fall to 1.31 billion by 2050.
- The policy affected society by creating smaller families with fewer siblings, resulting in smaller family networks and an ageing population.
- In India. campaigns such as ‘Hum Do, Hamare Do’ encouraged families to have only two children.
- Though the population is still growing in India, the fertility rate substantially fell from 5.7 in 1950 to 1.9 in 2025.
Other countries with low fertility rates include Japan, South Korea, Taiwan, Russia, Italy and Spain. These countries face challenges such as ageing populations and a shrinking working-age population, which can slow economic growth.
Dynamics of Population Class 8 Case Based Questions
Question 1.
Read the passage given below and answer the following questions.
The population pyramid for 2020 shows that a large portion of the population comprises children and young adults. This phenomenon of a large young population (16-30 years) is known as the youth bulge, which is common in countries at Stage 2 of demographic transition shown. Around 27% of the Indian population is under the age of 15 years and nearly 65% is in the working-age group (15-59 years).
(i) How does India’s population structure indicate potential for economic growth?
Answer:
A large working-age population (15-59 years) indicates potential for higher productivity and economic growth.
(ii) Which stage of demographic transition is India currently in according to the passage?
Answer:
India is in Stage 2 of the demographic transition.
(iii) What age group contributes to the youth bulge, and why is it significant?
Answer:
Young adults aged 16-30 years form the youth bulge, significant because they represent a large portion of the workforce.
Dynamics of Population Class 8 Picture Based Questions
Question 1.
Answer the questions based on the picture given below.
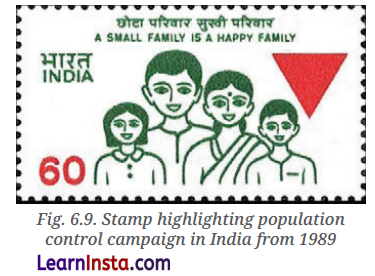
(i) Why was the stamp issued by India?
Answer:
The stamp was issued to promote population control by encouraging small families.
(ii) What social idea is promoted through this picture?
Answer:
The picture promotes the importance of having a small family for better health, resources, and well-being.
(iii) How does this idea benefit society?
Answer:
It helps reduce population pressure, improves living standards, and supports a healthier and more prosperous society.
Class 8 Dynamics of Population Extra Questions for Practice
Objective Type Questions
Question 1.
Which term refers to the total number of people living in a particular area at a given time?
(a) Population density
(b) Population size
(c) Migration rate
(d) Fertility rate
Question 2.
Which of the following factors can directly cause population decline?
(a) High birth rate
(b) Low death rate
(c) Out-migration
(d) Improved healthcare
Question 3.
What is the main reason why urban areas grow rapidly?
(a) High fertility in cities
(b) Migration from rural to urban areas
(c) Natural disasters
(d) Decline in agriculture
Question 4.
Which population pyramid shape indicates a country with very low birth rates and an ageing population?
(a) Triangular
(b) Bell-shaped
(c) Narrow base and wide top
(d) Wide base and narrow top
Question 5.
Which of the following is a likely effect of a large youth bulge in a country?
(a) Increased dependency ratio
(b) Shortage of schools
(c) Potential boost to economic growth
(d) Declining workforce
Question 6.
Which demographic indicator helps predict long-term population growth by showing the average number of children a woman will have in her lifetime?
(a) Birth rate
(b) Fertility rate
(c) Life expectancy
(d) Infant mortality rate
Question 7.
Why might countries with very low fertility rates face economic challenges In the future?
(a) Larger working-age population
(b) Shortage of young workers
(c) Increased school enrollment
(d) Decrease in elderly population
Question 8.
Which of the following best explains the term ‘dependency ratio’?
(a) Ratio of working-age population to total population
(b) Ratio of non-working people to working-age population
(c) Ratio of males to females in the population
(d) Ratio of children under 5 to elderly population
Subjective Type Questions
Question 1.
What is meant by child mortality rate?
Question 2.
Name one factor that can influence population growth.
Question 3.
Which age group is considered dependent?
Question 4.
Explain how migration can affect the population and economy of rural and urban areas.
Question 5.
How does education influence fertility and population growth?
Question 6.
How do fertility, mortality, and migration together influence a country’s population size and structure?
Question 7.
Compare the population pyramids of a developing country and a developed country, explaining the economic and social implications.
Question 8.
Describe how policy interventions can help countries benefit from their demographic dividend.