Get the simplified Extra Questions for Class 9 Maths and Ganita Manjari Class 9 Maths Chapter 10 How Quantities Combine Understanding Data Extra Questions with complete explanation.
Class 9 How Quantities Combine Understanding Data Extra Questions
Extra Questions on How Quantities Combine Understanding Data Class 9
Class 9 Ganita Manjari Chapter 10 Extra Questions
Question 1.
Section A of Class 9 has 30 students with a mean test score of 80, while Section B has 20 students with a mean score of 90. Calculate the overall combined mean test score of Class 9.
Solution:
Given, the number of students in Section A, n1 = 30
Mean score of Section A, x̄1 = 80
Number of students in Section B, n2 = 20
Mean score of Section B, x̄2 = 90
The combined mean is calculated using:
Combined Mean = \(\frac{n_1 \bar{x}_1+n_2 \bar{x}_2}{n_1+n_2}\)
Substituting the values:
= \(\frac{(30 \times 80)+(20 \times 90)}{30+20}=\frac{2400+1800}{50}=\frac{4200}{50}\)
Therefore, the overall combined mean test score of Class 9 is 84.
Question 2.
A 500 mL fruit punch solution contains 12% sugar. How much pure water must be added to reduce the concentration of sugar to 8%?
Solution:
Given, Initial volume of solution = 500 mL
Initial sugar concentration = 12%
Amount of sugar in the solution = \(\frac{12}{100}\) × 500 = 60 mL
Let the volume of water added be x ml.
New volume of solution = 500 + x
New concentration of sugar = 8%
ATQ: \(\frac{1}{2}\) × 100 = 8
⇒ \(\frac{1}{2}\) = 8
⇒ 6000 = 4000 + 8x
⇒ 8x = 2000
⇒ x = 250
Therefore, 250 mL of pure water must be added to reduce the sugar concentration to 8%.

Question 3.
State two key advantages of using a 100% Stacked Bar Chart over a traditional Pie Chart when representing proportional data.
Solution:
The two key advantages of using a 100% Stacked Bar Chart are:
- It allows easy comparison of proportions across multiple categories because all bars have the same length and represent 100% of the total.
- It can display changes in proportions over time or between different groups more clearly than a Pie Chart.
Question 4.
A student’s final term grade is computed using three assessment components weighted in the ratio 2:3:5.
- Class Tests (Weight 2): 70%
- Term Project (Weight 3): 80%
- Final Exam (Weight 5): 90%
Find the student’s overall weighted percentage score.
Solution:
Weighted percentage score
= \(\frac{(2 \times 70)+(3 \times 80)+(5 \times 90)}{2+3+5}\)
= \(\frac{140+240+450}{10}=\frac{830}{10}\) = 83%
Therefore, the student’s overall weighted percentage score is 83%.
Question 5.
The mean daily wage of 15 skilled workers is ₹ 600, and the mean daily wage of 10 unskilled workers is ₹ 400. Find the average daily wage of all 25 workers combined.
Solution:
Total wage of skilled workers = 15 × ₹ 600 = ₹ 9000
Total wage of unskilled workers = 10 × ₹ 400 = ₹ 4000
Total wage of all workers = ₹ 9000 + ₹ 4000 = ₹ 13000
Total number of workers = 15 + 10 = 25
Combined average wage = \(\frac{13000}{25}\) = ₹ 520
Therefore, the average daily wage of all 25 workers combined is ₹ 520.
How Quantities Combine Understanding Data Class 9 Short Question Answer
Question 1.
A customer review system rates a smartphone based on three criteria: Performance, Battery Life, and Camera Quality using weights in the ratio 4 : 3 : 3.
- User Arated them 5, 4, and 3 out of 5 stars, respectively.
- User B rated them 3, 5, and 4 out of 5 stars, respectively.
Calculate the weighted overall rating for both users and determine whose overall rating is higher.
Solution:
Ratings: for User A:
Performance = 5, Battery Life = 4, Camera Quality = 3
Weighted rating
= \(\frac{(4 \times 5)+(3 \times 4)+(3 \times 3)}{10}=\frac{20+12+9}{10}=\frac{41}{10}\) = 4.1
User A’s overall rating = 4.1 stars
Ratings: for User B:
Performance = 3, Battery Life = 5, Camera Quality = 4
Weighted rating
= \(\frac{(4 \times 3)+(3 \times 5)+(3 \times 4)}{10}=\frac{12+15+12}{10}=\frac{39}{10}\) = 3.9
User B’s overall rating = 3.9 stars
Therefore, User A has the higher overall rating than User B.
Question 2.
The mean weight of 20 male monkeys is 15 kg and the mean weight of 30 female monkeys is 12 kg.
(a) Find the overall mean weight of all 50 monkeys.
(b) If two male monkeys weighing 17 kg and 18 kg leave the group, calculate the new mean weight of the remaining male monkeys.
Solution:
(a) Total weight of male monkeys = 20 × 15 = 300 kg
Total weight of female monkeys = 30 × 12 = 360 kg
Total weight of all monkeys = 300 + 360 = 660 kg
Total number of monkeys = 20 + 30 = 50
Overall mean weight = \(\frac{660}{50}\) = 13.2
Therefore, the overall mean weight of all 50 monkeys = 13.2 kg.
(b) Original total weight of male monkeys = 20 × 15 = 300 kg.
Weight of monkeys leaving = 17 + 18 = 35 kg
Remaining total weight = 300 – 35 = 265 kg
Remaining number of male monkeys = 20 – 2 = 18
New mean weight: \(\frac{265}{18}\) = 14.72
Therefore, the new mean weight of remaining male monkeys is 14.72 kg (approximately).
Question 3.
Explain using algebraic formulation why doubling every weight w1, w2,…, wn in a dataset leaves the weighted mean x unchanged.
Solution:
The weighted mean is given by x = where,
w = weight of each observation x = value of each observation
If every weight is doubled, the new weight becomes: w’ = 2 w
New weighted mean: x’ = \(\frac{2 w_1 x_1+2 w_2 x_2+\ldots+2 w_n x_n}{2 w_1+2 w_2+\ldots+2 w_n}\)
= \(\frac{2\left(w_1 x_1+w_2 x_2+\ldots+w_n x_n\right)}{2\left(w_1+w_2+\ldots+w_n\right)}\)
= \(\frac{w_1 x_1+w_2 x_2+\ldots+w_n x_n}{w_1+w_2+\ldots+w_n}\) = x
Therefore, doubling all weights does not change the weighted mean.
Question 4.
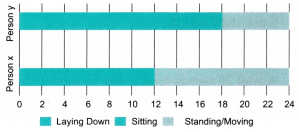
The following bar chart represents the daily hours spent by two individuals on different activities. Analyse the graph and convert the information into proportional percentages. Identify which person spends a greater relative proportion of their day in active movement and justify your answer.
Solution:
Total time for each person = 24 hours
Person X
| Activity | Hours | Percentage |
| Lying Down | 8 h | \(\frac{8}{24}\) × 100 = 33.33% 24 |
| Sitting | 10 h | \(\frac{10}{24}\) × 100 = 41.67% 24 |
| Standing/ Moving | 6 h | \(\frac{6}{24}\) × 100 = 25% 24 |
Person Y
| Activity | Hours | Percentage |
| Lying Down | 6 h | \(\frac{6}{24}\) × 100 =25% 24 |
| Sitting | 6 h | \(\frac{6}{24}\) × 100 = 25% 24 |
| Standing/ Moving | 12 h | \(\frac{12}{24}\) × 100 = 50% 24 |
Comparison:
Person X spends 25% of the day in active movement. Person Y spends 50% of the day in active movement. Therefore, Person Y spends a greater relative proportion of their day in active movement.
Question 5.
A trader buys 40 kg of wheat at ₹ 25/kg, 30 kg at ₹ 30/kg, and x kg at ₹ 35/kg. If the weighted average price of the entire stock is ₹ 30/kg, determine the value of x.
Solution:
Weighted average price of the entire stock = ₹ 30
Weighted average = \(\frac{\text { Total Cost }}{\text { Total Quantity }}\) = 30
Total cost = (40 ×25) + (30 × 30) + (x × 35)
= 1000 + 900 + 35x
Total quantity = 40 + 30 + x = 70 + x
Therefore, \(\frac{1900+35 x}{70+x}\) = 30
⇒ 1900 + 35x = 30(70 + x)
⇒ 1900 + 35x = 2100 + 30x
⇒ 35x – 30x = 2100 – 1900
⇒ 5x = 200
⇒ x = 40
Therefore, the trader bought 40 kg of wheat at ₹ 35/kg.
How Quantities Combine Understanding Data Class 9 Long Question Answer
Question 1.
Three batches of brass alloy are melted together:
- Batch A: Weighs 150 kg containing 60% copper.
- Batch B: Weighs 250 kg containing 70% copper.
- Batch C: Weights an unknown weighty kg containing 80% copper.
The final combined alloy has a copper concentration of 72%.
(a) Set up the weighted mean equation to findy.
(b) Calculate the exact weight of Batch C.
(c) Find the total weight of the combined alloy.
Solution:
(a) Weighted mean equation
= \(\frac{(150 \times 60)+(250 \times 70)+(y \times 80)}{150+250+y}\) = 72
(b) The weight of Batch C:
\(\frac{9000+17500+80 y}{400+y}\) = 72
⇒ 26500 + 80y = 72(400 + y)
⇒ 26500 + 80y = 28800 + 72y
⇒ 80y – 12y = 28800 – 26500
⇒ 8y = 2300
⇒ y = 287.5
Weight of Batch C = 287.5 kg
(c) Total weight of the combined alloy
= 150 + 250 + 287.5
= 687.5 kg
Question 2.
An online streaming platform compares the total view- hours of three genres across two regions using the
(a) Calculate the percentage share of each genre for Region A and Region B.
Solution:
Percentage share of each genre:
Region A
Drama = \(\frac{400}{1600}\) × 100 = 25%
Action = \(\frac{800}{1600}\) × 100 = 50%
Comedy = \(\frac{400}{1600}\) × 100 = 25%
Region B
Drama = \(\frac{600}{1200}\) × 100 = 50%
Action = \(\frac{300}{1200}\) × 100 = 25%
Comedy = \(\frac{300}{1200}\) × 100 = 25%
(b) Draw a 100% Stacked Bar Chart for the given data and label each section with its corresponding percentage value.
Solution:
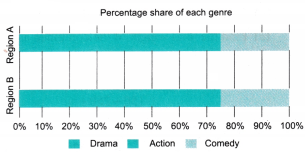
(c) Which graph type is best suited for comparing the total consumption between the two regions? Which graph type is best for comparing the internal proportional preferences?
Solution:
Suitable graph types
- To compare total consumption between the two regions: Cluster Column Chart is more suitable.
- To compare internal proportional preferences of genres: 100% Stacked Bar Chart is more suitable.
Question 3.
Prove algebraically whether adding a fixed constant k > 0 to all weights w1, w2,…> wn (where in one line x1 < x2 …………… < xn) changes the weighted mean x or not. Illustrate with an explicit numerical example.
Solution:
The weighted mean is x = \(\frac{w_1 x_1+w_2 x_2+\ldots+w_n x_n}{w_1+w_2+\ldots+w_n}\)
If a constant k is added to every weight the new weights.
w’ = w + k
New weighted mean:
x’ = \(\frac{\left(w_1+k\right) x_1+\left(w_2+k\right) x_2+\ldots+\left(w_n+k\right) x_n}{\left(w_1+k\right)+\left(w_2+k\right)+\ldots+\left(w_n+k\right)}\)
x’ = \(\frac{\left(w_1 x_1+w_2 x_2+\ldots+w_n x_n\right)+k\left(x_1+x_2+\ldots+x_n\right)}{\left(w_1+w_2+\ldots+w_n\right)+k n}\)
where n is the number of observations.
This is generally not equal to the original weighted mean
\(\frac{w_1 x_1+w_2 x_2+\ldots+w_n x_n}{w_1+w_2+\ldots+w_n}\)
Therefore, adding a fixed constant to all weights changes ’ the weighted mean in general.
Numerical Example:
Consider the values: x1 = 10, x2 = 20
Weights: w1 = 1, w2 = 3
Original weighted mean
= \(\frac{(1 \times 10)+(3 \times 20)}{1+3}=\frac{10+60}{4}\) = 17.5
Now add (k = 1) to each weight:
New weights: w’1 = 2, w’2 = 4
New weighted mean:
\(\frac{(2 \times 10)+(4 \times 20)}{2+4}=\frac{20+80}{6}\) = 16.67
Since 16.67 ≠ 17.5
Adding a fixed constant to all weights changes the weighted mean.
Question 4.
A pool 20 meters long is dug to varying depths across 4 sections as given below (inspired by Brahmagupta’s formula for irregular pits):
- Section 1: Length = 4 m, Depth = 6 m
- Section 2: Length = 6 m, Depth = 5 m
- Section 3: Length = 5 m, Depth = 4m
- Section 4: Length = 5 m, Depth = 2 m
(a) Write the general weighted average formula given by Brahmagupta for mean depth.
(b) Calculate the mean depth of the pool.
(c) Calculate the total volume of earth excavated if the
width of the pool is uniformly 3 meters.
Solution:
(a) General weighted average formula
Mean Depth = \(\frac{\text { Sum of products of lengths and depths }}{\text { Sum of lengths }}\)
(b) The mean depth of the pool
= \(\frac{(4 \times 6)+(6 \times 5)+(5 \times 4)+(5 \times 2)}{4+6+5+5}\)
= \(\frac{24+30+20+10}{20}=\frac{84}{20}\) = 4.2
The mean depth of the pool is 4.2 m.
(c) Total volume of earth excavated
= Length × Width × Depth = 20 × 3 × 4.2 = 252
Total volume of earth excavated = 252 m3
How Quantities Combine Understanding Data Class 9 Case Based Questions
Question 1.
A town board tracks the daily electricity consumption (in kWh) of two sectors (Residential and Commercial) across two appliance categories.
| Sector | Lighting and cooling | Heavy Appliances |
| Residential | 300 kWh | 200 kWh |
| Commercial | 600 kWh | 900 kWh |
(i) Find the total electricity consumption (in kWh) of the residential and commercial sectors separately.
(ii) A student claims: “Because the percentage share of lighting and cooling is higher in the residential sector (60%) than in the commercial sector (40%), the Residential sector consumes a larger actual amount of electricity on lighting and cooling. ” Evaluate whether this claim is correct or incorrect using mathematical reasoning.
(iii) What percentage of total electricity in the residential sector is consumed by lighting and cooling?
OR
What percentage of total electricity in the commercial sector is consumed by heavy appliances.
Solution:
(i) Residential sector:
Total electricity consumption
= Lighting and cooling + Heavy appliances
= 300 kWh + 200 kWh
= 500 kWh
Commercial sector:
Total electricity consumption
= Lighting and cooling + Heavy appliances
= 600 kWh + 900 kWh
= 1500 kWh
(ii) To check the claim, compare the actual electricity consumption for lighting and cooling.
Residential lighting and cooling consumption
= 300 kWh
Commercial lighting and cooling consumption
= 600 kWh
Although the residential sector uses a higher percentage of its total electricity for lighting and cooling, it consumes 60% of 500 = 300 kWh.
The commercial sector uses 40% of 1500 = 600 kWh
Since 600 kWh > 300 kWh, the commercial sector consumes a larger actual amount of electricity for lighting and cooling.
The student’s claim is incorrect. A higher percentage does not always mean a higher actual amount. The actual consumption depends on the total electricity used by the sector.
(iii) Percentage of lighting and cooling consumption in the residential sector:
\(\frac{\text { Lighting and cooling consumption }}{\text { Total residential consumption }}\) × 100
= \(\frac{300}{500}\) × 100 = 60%
Or
Percentage of heavy appliances consumption in the commercial sector:
= \(\frac{\text { Heavy appliences consumption }}{\text { Total commericial consumption }}\) × 100
= 60%
Question 2.
A sports academy evaluates the performance of player in a tournament based on three parameters: Skill, Teamwork, and Fitness. The relative weightage assigned to these parameters by the coaches is 5 : 3 : 2 respectively.
The feedback summary collected from coaches (each rating out of 5 starts):
| Star Rating | Skill | Teamwork | Fitness |
| 5 stars | 10 | 4 | 2 |
| 4 stars | 5 | 6 | 3 |
| 3 stars | 5 | 10 | 5 |
(i) Calculate the mean rating given by coaches for skill.
(ii) Calculate the mean rating for teamwork and fitness.
(iii) Using the weighted mean formula with weights 5:3:2, calculate the combined overall performance rating of the player.
Solution:
Coach’s feedback:
| Star Rating | Skill | Teamwork | Fitness |
| 5 stars | 10 | 4 | 2 |
| 4 stars | 5 | 6 | 3 |
| 3 stars | 5 | 10 | 5 |
Total number of ratings for each parameter = 10 + 5 + 5
= 20
(i) Mean rating formula:
Mean = \(\frac{\text { Sum of products of rating and coaches }}{\text { Total number of coaches }}\)
For skill:
Mean = \(\frac{(5 \times 10)+(4 \times 5)+(3 \times 5)}{20}\)
= \(=\frac{50+20+15}{20}=\frac{85}{20}\) = 4.25
Mean rating for skill = 4.25 stars
(ii) Teamwork:
Mean = \(\frac{(5 \times 4)+(4 \times 6)+(3 \times 10)}{20}\)
= \(\frac{20+24+30}{20}=\frac{74}{20}\) = 3.7
Mean rating for teamwork = 3.7 stars
Fitness:
Mean = \(\frac{(5 \times 2)+(4 \times 3)+(3 \times 5)}{20}\)
= \(\frac{10+12+15}{20}=\frac{37}{20}\) = 1.85
Mean rating for fitness =1.85 stars
(iii) Coaches weights:
Skill: Teamwork : Fitness = 5:3:2
Weighted mean =
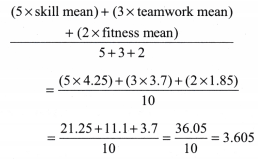
Therefore, the overall customer rating of the player is 3.61 stars (approximately).
How Quantities Combine Understanding Data Class 9 Competency Based Questions
Question 1.
A school evaluates the success of its annual event using three components: Organisation, participation and creativity. The organising committee assigns weights according to their importance.
| Component | Score Obtained | Weight |
| Organisation | 80 | 2 |
| Participation | 90 | 3 |
| Creativity | 75 | 5 |
(a) Calculate the weighted mean score of the school event.
(b) A student claims that participation has the greatest effect on the overall success score because it has the highest score. Is the claim correct? Justify using mathematical reasoning.
(c) If the weight of the creativity is increased from 5 to 7 while other weights remain the same, will the overall success score increase or decrease? Calculate the new weighted mean.
Solution:
(a) Weighted Mean = \(\frac{(80 \times 2)+(90 \times 3)+(75 \times 5)}{2+3+5}\)
\(\frac{160+270+375}{10}=\frac{805}{10}\) = 80.5
Weighted mean score = 80.5
(b) The claim is incorrect.
Although participation has the highest score (90), the creativity has the highest weight (5), so it contributes more to the final score.
(c) New weighted, mean:
= \(\frac{(80 \times 2)+(90 \times 3)+(75 \times 7)}{2+3+7}\)
= \(\frac{160+270+525}{12}=\frac{955}{12}\) = 79.58
The new weighted mean becomes 79.58, so the overall score decreases.
Question 2.
A city records how households manage their monthly waste.
| Waste Type | Area A | Area B |
| Recycled Waste | 40% | 25% |
| Compostable Waste | 35% | 45% |
| Landfill Waste | 25% | 30% |
(a) Represent the data using a 100% stacked bar chart. Which area manages a higher percentage of waste through recycling?
(b) A resident says, “Area B produces less landfill waste because it recycles less waste. ” Examine this statement and explain whether it is correct.
(c) If Area A has 800 households and Area B has 1200 households, calculate the actual number of households whose waste is sent to landfill in each area.
Solution:
(a) From the given table:
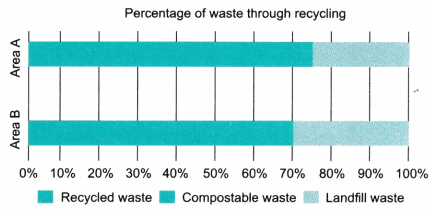
- Area A recycling = 40%
- Area B recycling = 25%
Therefore, Area A has a higher recycling percentage.
(b) The statement is incorrect.
A percentage comparison does not always show actual quantities. Area B has a lower recycling percentage, but the total number of households may be different. Actual waste depends on the total number of households.
(c) Area A landfill households:
25% of 800 = \(\frac{25}{100}\) × 800 = 200
Area B landfill households:
30% of 1200 = \(\frac{30}{100}\) × 1200 = 360
- Area A sends the waste of 200 households to the landfill.
- Area B sends the waste of 300 households to the landfill.
How Quantities Combine Understanding Data Extra Questions for Practice
Multiple Choice Questions
Question 1.
The weighted mean of values is calculated by:
(a) Adding all values and dividing by the number of values
(b) Multiplying values by their weights and dividing by the sum of weights
(c) Adding all weights and values together
(d) Dividing values by their respective weights
Question 2.
A 100% stacked bar chart is mainly used to compare:
(a) Exact values only
(b) Proportions or percentages of different categories
(c) Only the largest value in a dataset
(d) The average of a dataset
Question 3.
If 40% of 500 students prefer online learning, the number of students is:
(a) 100
(b) 150
(c) 200
(d) 250
Assertion-Reason Questions
Two statements are given, one labelled as Assertion (A) and the other labelled as Reason (R). Select the correct answer from the options (a), (b), (c), and (d) given below.
(a) Both Assertion (A) and Reason (R) are true and Reason (R) is the correct explanation of the Assertion (A).
(b) Both Assertion (A) and Reason (R) are true, but Reason (R) is not the correct explanation of the Assertion (A).
(c) Assertion (A) is true, but Reason (R) is false.
(d) Assertion (A) is false, but Reason (R) is true.
Question 1.
Assertion (A): A weighted mean is used when different values have different levels of importance.
Reason (R): All values always contribute equally while calculating a weighted mean.
Question 2.
Assertion (A): A sector using 60% of its electricity for lighting may not consume more electricity than a sector using 40%.
Reason (R): Actual consumption depends on both the percentage and the total quantity.
Question 3.
Assertion (A): A simple average cannot always be used to combine data from groups of different sizes.
Reason (R): Groups with more observations should have greater influence on the combined average.
Short Answer Type Questions
Question 1.
The marks of a student in three activities are 80, 90, and 70. The corresponding weights are 2, 3, hnd 5 respectively. Find the weighted mean.
Question 2.
Why is a 100% stacked bar chart useful for comparing data?
Question 3.
A restaurant collects customer ratings for food and service. Food receives ratings of 5,4, and 3 stars from 10,8, and 2 customers respectively. Find the mean rating for food.
Question 4.
Explain why comparing only percentages can sometimes give incorrect conclusions.
Long Answer Type Questions
Question 1.
A school calculates the final grade of students using three components:
| Component | Score | Weight |
| Assignment | 78 | 3 |
| Project | 85 | 2 |
| Examination | 92 | 5 |
Calculate the weighted mean score and explain which component has the greatest influence. 12. Two towns record their monthly water usage.
| Town | Total water usage | Water used for gardening |
| Town A | 2000 litres | 600 litres |
| Town B | 5000 litres | 1500 litres |
Answer the following:
(a) Find the percentage of water used for gardening in each town.
(b) Which town uses more water for gardening?
(c) Explain why a higher percentage does not always mean a higher actual amount.