Students often refer to Ganita Manjari Class 9 Solutions and Part 2 Class 9 Maths Chapter 10 How Quantities Combine Understanding Data Solutions to verify their answers.
How Quantities Combine Understanding Data Class 9 Solutions
Class 9 Ganita Manjari Chapter 10 Solutions
Class 9 Maths Ganita Manjari Chapter 10 Solutions How Quantities Combine Understanding Data
Think and Reflect (NCERT Textbook Page No. 8)
Why did Method 1 not work?
Solution:
Do it Yourself.
In-text Questions (NCERT Textbook Page No. 19-20)
Answer the following questions based on the charts above. Try to answer each question by looking at Choice 1 first, and then Choice 2. Which was easier?
Question 1.
Which family spent the least on housing?
Solution:
Family C spent the least on housing (From choice 1).
Question 2.
Which family spent the most on healthcare?
Solution:
Family A spent the most on healthcare (From choice 1).
Question 3.
Approximately how much did Family A spend on education?
Solution:
Approximately ?1250 is spent by Family A on education (From choice 2).
Question 4.
Which category did Family B spend most on?
Solution:
Family B spent the most on housing (From choice 2).
Question 5.
Did Family A spent more on food or on healthcare?
Solution:
Family A spent more on healthcare compared to food (From choice 2).
Question 6.
Which family spent the least amount overall?
Solution:
Expenditure of family A
= 1900 + 1700 + 1350 + 1200 + 1800 + 550 = ₹ 8500
Approximately
Expenditure of family B
= 1700 + 1550 + 1500 + 1200 + 1300 = ₹ 7250
Approximately
Expenditure of family C
= 900 + 1700 + 1550 + 1400 + 1350 + 150 = ₹ 7050
Approximately
Family C spent the least amount overall.
Question 7.
Approximately how much did Family C spend overall?
Solution:
Family C spent approximately ₹ 7100 overall.

Question 8.
Approximately what percentage of Family C’s expenses were on housing?
Solution:
\(\frac{900}{7100}\) × 100 = 2.67%.
Therefore, Family C spent 12.67% of overall expenses on housing.
Think and Reflect (NCERT Textbook Page No. 26)
Question 1.
What does this say about the scope of stacked bars and 100% stacked bars?
Solution:
Stacked Bar Chart: Represents absolute quantities/values as well as the overall total. It allows the comparison of total amounts across different categories.
100% Stacked Bar Chart: Represents relative proportions or percentages of each category out of 100%. It allows comparison of internal distributions across different groups regardless of overall total amounts.
Question 2.
Given a stacked bar chart, can we make a corresponding 100% stacked bar chart? ,
Solution:
Yes: From a stacked bar chart, the absolute value of each segment and the total length (sum) of the bar are known. By calculating \(\left(\frac{\text { Segment Value }}{\text { Total Value }}\right)\) × 100, each segment can be converted into a percentage to construct the corresponding 100% stacked bar chart.
Question 3.
Given a 100% stacked bar chart, can we make a corresponding stacked bar chart?
Solution:
No (in general): A 100% stacked bar chart provides only percentage proportions, not actual numerical values or total quantities. Without knowing the absolute total value of the group, a standard stacked bar chart cannot be created.
Question 4.
What kind of inferences or comparisons can be made from a stacked bar chart and in a 100% stacked bar chart?
Solution:
Stacked Bar Chart: It allows a comparison of total magnitudes (e.g., total expenditure, total species count) and absolute sizes of individual components.
100% Stacked Bar Chart: It allows a comparison of component proportions/shares relative to the total within each category (e.g., percentage of time spent on leisure vs. work).
Think and Reflect (NCERT Textbook Page No. 27)
Question 1.
What do you find interesting in the chart above (Fig. 10.6)? What can you infer? Discuss.
Solution:
Learning Time: Flighest among children aged 6-14 (22%) and significantly decreases with age (11% in youth, 2% in adults, and 0% in the elderly).
Paid Work: Increases from youth (7%) to adults (14%) and drops significantly in the elderly (7%).
Unpaid Work & Care: Increases from youth (9%) to adults (15%) and then decreases in the elderly (9%).
Leisure, Social & Travel: Highest among the elderly (33%).
Question 2.
Do you remember the sleep time over age trend that you studied last year? Does that trend align with this chart?
Solution:
Yes: The data shows children spend the highest percentage of time sleeping (38%), which decreases in youth (34%) and adults (32%), before slightly rising again for the elderly individuals (37%). This aligns with the established physiological trend that children require more sleep than adults.
Question 3.
Can you explain why the learning time of people in the age group 15-24 has reduced significantly compared to that of the age group 6-14?
Solution:
Children in the 6-14 age group are predominantly full¬time school students. In the 15-24 age group, many individuals transition out of formal education into higher technical training, employment (paid work), or household responsibilities (unpaid work), thereby reducing the overall proportion of time allocated purely to formal learning.
Question 4.
Do adults spend about an equal amount of time in paid and unpaid work? What do you think?
Solution:
For adults (25-59), paid work accounts for 14% and unpaid work & care accounts for 15% of the total day. Thus, at an overall aggregate average level, adults spend nearly equal proportions of time on paid and unpaid work.
Think and Reflect (NCERT Textbook Page No. 28)
Do you remember the ‘What Can A Strip Say?’ activity from last year? In each strip, if we club the tiny strips belonging to each activity together, will we get a 100% stacked bar chart like the one in Fig. 10.6?
Solution:
Yes: Clubbing all sub-segments corresponding to a specific activity together aggregates them into single proportional blocks that sum up to 100% (or 24 hours) of the day. This directly forms a 100% stacked bar chart representation.
Think and Reflect (NCERT Textbook Page No. 30)
Question 1.
Will the bars look similar if a different teacher’s data is considered instead of Zakir’s?
Solution:
Yes, broadly similar: Teachers generally follow similar daily schedules involving standing while teaching, sitting during planning/grading, and sleeping/resting. However, minor individual variations will exist based on personal lifestyle and school schedules.
Question 2.
Will the bars look different if the data for all 7 days of the week is considered?
Solution:
Yes: Weekend routines (Saturday and Sunday) differ significantly from weekday routines, as individuals spend less time in work-related postures (sitting/standing at work) and more time lying down or engaging in recreational activities.
Question 3.
Some bars in the chart may also match people doing other kinds of work/activities. Can you think of any? Discuss.
Solution:
Pavani (Patient): Matches individuals recovering from illness, bedridden elderly, or individuals on complete bed rest.
Raghu (Nurse): Matches security guards, retail salespersons, traffic police officers, or field engineers who spend extended hours standing or moving.
Zakir (Teacher): Matches office managers, desk-job supervisors, or lab assistants who split time between sitting and standing.
Ex 10.1 Class 9 Ganita Manjari Solutions – Ganita Manjari Class 9 Exercise 10.1 Solutions
Exercise 10.1 Class 9 Ganita Manjari Solutions – Ganita Manjari Class 9 Ex 10.1 Solutions
Question 1.
The average score of students on a test in Section A is 72 and that of students in Section B is 76vWhat is the combined average of both the sections given that Section A has 30 students and Section B has 25 students?
Solution:
Given that the average score of 30 students in Section A is 72 and the average score of 25 students in Section B is 76.
The total score of Section A = 30 × 72 = 2160
The total score of Section B = 25 × 76 = 1900
The total combined score for both sections = 2160 + 1900 = 4060
The total number of students across both sections = 30 + 25 = 55
Combined Average = \(\frac{4060}{55}=\frac{812}{11}\) ≈ 73.82
Therefore, the combined average score of both sections is \(\frac{812}{11}\) (or approximately 73.82).
Question 2.
A farmer mixes three equal quantities of fertilisers. The first one contains \(\frac{1}{10}\) nitrogen, the second contains \(\frac{9}{50}\) nitrogen, and the third contains \(\frac{3}{60}\) nitrogen. What is the fraction of nitrogen in the mixture?
Solution:
Method 1:
Let each equal quantity of fertilizer be x units.
The amount of nitrogen in the first fertilizer is \(\frac{1}{10}\)x , in the second fertilizer is \(\frac{9}{50}\) x , and in the third fertilizer is \(\frac{3}{60}\)x , which is equal to \(\frac{1}{20}\)x .
The total amount of nitrogen in the mixture
= \(\left(\frac{1}{10}+\frac{9}{50}+\frac{1}{20}\right)\)x
Taking the LCM of the denominators 10,50, and 20, which is 100:
The total quantity of the mixture = x + x + x = 3x
The fraction of nitrogen in the combined mixture 33
= \(\frac{\frac{33}{100} x}{3 x}=\frac{33}{300}=\frac{11}{100}\)
Therefore, the fraction of nitrogen in the mixture is \(\frac{11}{100}\).
Method 2:
As the quantities of three fertilizers are equal we can find the fraction of nitrogen directly.
Total Nitrogen = \(\left(\frac{10+18+5}{100}\right)=\frac{33}{100}\)
Fraction of Nitrogen = \(\frac{\text { Total Nitrogen }}{\text { Number of fertilizers }}\)
= \(\frac{\frac{33}{100}}{3}=\frac{11}{100}\)
Question 3.
(Srldharacarya, PatTganita, c. 750 CE) In ancient India, Varna was the measure of gold purity. A purity of 16 varna meant pure gold; in general, a purity of k varna meant that the go 1 d-al 1 oy was kl\6 gold and the rest impurities. (Now the term used is karat; 16 Varna = 24 karat.)
Suppose a goldsmith melts together three pieces of gold: 9 units at 12 varna, 5 units at 10 varna, and 17 units at 11 varna. Find the purity in varna of the combined gold.
Solution:
The total purity content of the three pieces of gold is obtained by adding the product of the units and their respective purity in varna:
Total purity content = (9 × 12) + (5 × 10) + (17 × 11)
= 108 + 50 + 187
= 345
The total units of gold melted together = 9 + 5 + 17 = 31
The purity in varna of the combined gold is given by:
Combined Purity = \(\frac{345}{31}\) = 11\(\frac{4}{31}\) ≈ 11.13
the purity in varna of the combined gold is \(\frac{345}{31}\) (or approximately 11.13 varna).
Question 4.
The average rainfall per day in the months of May, June, and July in a certain location are 3.5 mm, 10 mm and 8.7 mm respectively. Write an expression that gives their combined average.
Solution:
The month of May has 31 days, June has 30 days, and July has 31 days.
The total rainfall during these three months = (31 × 3.5) + (30 × 10)+ (31 × 8.7)
The total number of days across the three months = 31 + 30 + 31
Dividing the total rainfall by the total number of days gives the required expression for the combined average daily rainfall.
Combined Average = \(\frac{(31 \times 3.5)+(30 \times 10)+(31 \times 8.7)}{31+30+31}\)
Question 5.
Calculate the concentration of spice mix in these two scenarios.
(i) A 100 mL kashayam/kadha with 5% spice mix, a 200 mL one with 10% spice mix, and a 300 mL one with 15% spice mix are combined.
(ii) A 300 mL kashayam/kadha with 5% spice mix, a 200 mL one with 10% spice mix, and a 100 mL one with 15% spice mix are mixed.
Solution:
The volume of spice mix in the first solution
= 5% of 100 mL = 5 mL.
The volume of spice mix in the second solution
= 10% of 200 mL = 20 mL.
The volume of spice mix in the third solution
= 15% of 300 mL = 45 mL.
The total volume of spice mix = 5 + 20 + 45 = 70mL.
The total volume of the mixture = 100 + 200 + 300
= 600 mL.
The concentration of the combined mixture
= \(\frac{70}{600}\) × 100%
= \(\frac{35}{3}\)% ≈ 11.67%
(ii) The volume of spice mix in the first solution = 5% of 300 mL = 15 mL.
The volume of spice mix in the second solution = 10% of 200 mL = 20 mL.
The volume of spice mix in the third solution = 15% of 100 mL = 15 mL.
The total volume of spice mix = 15 + 20 + 15
= 50 mL.
The total volume of the mixture = 300 + 200 + 100
= 600 mL.
The concentration of the combined mixture
= \(\frac{50}{600}\) × 100%
= \(\frac{25}{3}\)% ≈ 8.33%
Ex 10.2 Class 9 Ganita Manjari Solutions – Ganita Manjari Class 9 Exercise 10.2 Solutions
Exercise 10.2 Class 9 Ganita Manjari Solutions – Ganita Manjari Class 9 Ex 10.2 Solutions
Question 1.
Savitri’s marks in Kashmiri are as follows: 35 out of 50 in internal tests, 44 out of 60 in the project, and 80 out of 100 in the final exam. The annual percentage score is calculated by combining the internals, project, and final exam in the ratio 3 : 4 : 5. Which of the following expression(s) gives her annual score (as a percentage) in Kashmiri?
(i) \(\frac{35 \times 3+44 \times 4+80 \times 5}{3+4+5}\)
(ii) \(\frac{\left(\frac{35}{100}\right) \times 3+\left(\frac{44}{100}\right) \times 4+\left(\frac{80}{100}\right) \times 5}{3+4+5}\)
(iii) \(\frac{\left(\frac{35}{100}\right) \times 3+\left(\frac{44}{100}\right) \times 4+\left(\frac{80}{100}\right) \times 5}{3+4+5} \times 100\)
(iv) \(\frac{\left(\frac{35}{50} \times 100\right) \times 3+\left(\frac{44}{60} \times 100\right) \times 4+\left(\frac{80}{100} \times 100\right) \times 5}{3+4+5}\)
Solution:
To find the percentage score for each component individually:
• Internal tests percentage: \(\frac{35}{50}\) × 100
• Project percentage: \(\frac{44}{60}\) × 100
• Final exam percentage: \(\frac{80}{100}\) × 100
A weighted average combines each value by multiplying it by its respective weight, summing those products, and dividing by the total sum of the weights:
Weighted Average = \(\frac{\text { Component }_1 \times w_1+\text { Component }_2 \times w_2+\text { Component }_3 \times w_3}{w_1+w_2+w_3}\)
Substituting the percentages into this weighted average formula with weights 3. 4, and 5:
Annual Score(%) = \(\frac{\left(\frac{35}{50} \times 100\right) \times 3+\left(\frac{44}{60} \times 100\right) \times 4+\left(\frac{80}{100} \times 100\right) \times 5}{3+4+5}\)
This matches expression (iv).
Factoring out 100 from each erm in the numerator yields:
Annual Score(%) = \(\frac{\left[\left(\frac{35}{50}\right) \times 3+\left(\frac{44}{60}\right) \times 4+\left(\frac{80}{100}\right) \times 5\right] \times 100}{3+4+5}\)
Rewriting the constant factor of lOO outside the fraction gives:
Annual Score(%) = \(\frac{\left(\frac{35}{50}\right) \times 3+\left(\frac{44}{60}\right) \times 4+\left(\frac{80}{100}\right) \times 5}{3+4+5}\) × 100
This matches expression (iii).
Therefore, both expressions (iii) and (iv) correctly calculate
Savitri’s annual score as a percentage.
Ex 10.3 Class 9 Ganita Manjari Solutions – Ganita Manjari Class 9 Exercise 10.3 Solutions
Exercise 10.3 Class 9 Ganita Manjari Solutions – Ganita Manjari Class 9 Ex 10.3 Solutions
Question 1.
A stationery shop owner made ₹ 8000 selling books, of which 30% is the profit amount, and ₹ 1000 selling book covers, of which 50% is the profit amount. What is the percentage of profit on the. total sales?
Solution:
Selling price of books = ₹ 8000
Profit percentage on books = 30%
Profit amount from books = 30% of ₹ 8000
= \(\frac{30}{100}\) × 8000 = ₹ 2400
Selling price of book covers = ₹ 1000
Profit percentage on book covers = 50%
Profit amount from book covers = 50% of ₹ 1000
= \(\frac{50}{100}\) × 1000 = ₹ 500 100
Total sales amount = ₹ 8000 + ₹ 1000 = ₹ 9000
Total profit amount = ₹ 2400 + ₹ 500 = ₹ 2900
Percentage of profit on total sales
= \(=\frac{\text { Total Profit }}{\text { Total Sales }}\) × 100 = \(\frac{2900}{9000}\) × 100
= \(\frac{290}{9}\)% ≈ 32.22%
Therefore, the percentage of profit on total sales is
32.22% or \(\frac{290}{9}\) %
Question 2.
A white stork’s migration is tracked. The average daily distance travelled, calculated over 20 days, is 44.5 km. On the 21st day, it flew 55 km. What is the average daily distance travelled over these 21 days? Make a guess before you calculate.
Solution:
Average daily distance for the first 20 days = 44.5 km
Total distance travelled in 20 days = 20 × 44.5 = 890 km
Distance travelled on the 21st day = 55 km
Total distance travelled in 21 days = 890 + 55 = 945 km
Guess:
Since the bird covered 55 km on the 21st day, which is greater than the previous average of 44.5 km, the new 21- day average will be slightly greater than 44.5 km.
Calculation:
New Average = \(\frac{\text { Total Distance }}{\text { Total Days }}=\frac{945}{21}\) = 45 km
Therefore, the average daily distance travelled over these 21 days is 45 km.
Question 3.
A 600 mL solution with 5% salt is mixed with a 300 mL solution with 8% sugar. What are the concentrations of salt and sugar in the mixture?
(i) Salt: 5%, Sugar: 8%
(ii) Salt: 13%, Sugar: 3%
(iii) Salt 6%, Sugar: 6%
(iv) Salt: 5.55%, Sugar: 8.88%
(v) Salt: 3.33%, Sugar: 2.67%
(vi) Salt: 4.1%, Sugar: 7.08%
Solution:
Volume of salt solution = 600 mL with 5% salt concentration
Amount of salt in the mixture = 5% of 600 mL
= \(\frac{5}{100}\) × 600 = 30 mL
Volume of sugar solution = 300 mL with 8% sugar concentration
Amount of sugar in the mixture = 8% of 300 mL
= \(\frac{8}{100}\) × 300 = 24 mL
Total volume of the combined mixture
= 600 mL + 300 mL = 900 mL
Concentration of salt in the mixture:
Salt Concentration = \(\frac{30}{900}\) × 100%
= \(\frac{30}{9}\) %
= \(\frac{10}{3}\)% ≈ 3.33%
Concentration of sugar in the mixture: 24
Sugar Concentration =\(\frac{24}{900}\) × 100%
= \(\frac{24}{9}\) %
= \(\frac{8}{3}\)% ≈ 2.67%
This matches option (v).
Question 4.
At a panipuri (golgappa) stall, the concentration of spice in the pani (spiced water) was 8%. Many customers complained that it was too spicy. What quantity of regular water should be mixed into the 10 litres of pani so that the spice level is reduced to \(\left(\frac{3}{4}\right)^{\mathrm{th}}\) of the original concentration?
Solution:
Initial volume of pani (V1) = 10 litres
Original spice concentration (C1) = 8%
Amount of spice present = 8% of 10 litres = 0.8 litres
Target spice concentration (C2)
= \(\frac{3}{4}\) of original concentration = \(\frac{3}{4}\) × 8% = 6%.
Let x litres of regular water be added to the solution.
New total volume of pani (V2) = 10 + x litres
Since the total amount of spice remains constant:
C2 × V2 = Amount of Spice
⇒ 6% × (10 + x) = 0.8
⇒ \(\frac{6}{100}\) × (10 + x) = 0.8
⇒ 6 × (10 + x) = 80
⇒ 60 + 6x = 80
⇒ 6x = 20
⇒ x = \(\frac{20}{6}=\frac{10}{3}\) = 3.33 litres
Therefore, the quantity of regular water that should be mixed is \(\frac{10}{3}\) litres (or 3.33 litres).
Question 5.
A physical fitness evaluation is being undertaken. The final marks are calculated by combining the marks for strength, flexibility, and agility in the ratio 4: 5: 6. Rashi has scored 60, 65, and 70. Keerthi has scored 55, 65, and 75 respectively.
(i) Find out whose total is more without calculating.
(ii) What are their final marks?
Solution:
Ratio of weights for strength, flexibility, and agility = 4: 5: 6
(i) Without calculating, Rashi’s scores increase sequentially (60 to 65 to 70) while Keerthi’s scores start lower but end higher (55 to 65 to 75). Because the highest weight (6) is given to agility, where Keerthi scored her highest mark (75), and the lowest weight (4) is given to strength, where Keerthi scored her lowest mark (55), Keerthi’s higher performance in the heavily weighted component gives her a higher total score. Thus, Keerthi’s total is more.
(ii) Rashi’s weighted final mark:
= \(\frac{(60 \times 4)+(65 \times 5)+(70 \times 6)}{4+5+6}\)
= \(\frac{240+325+420}{15}=\frac{985}{15}=\frac{197}{3}\) = 65.67
Keerthi’s weighted final mark:
= \(\frac{(55 \times 4)+(65 \times 5)+(75 \times 6)}{4+5+6}\)
= \(\frac{220+325+450}{15}=\frac{995}{15}=\frac{199}{3}\) = 66.33
Therefore, Rashi’s final mark is 65.67, and Keerthi’s final mark is 66.33.
Question 6.
A restaurant collected ratings from 10 customers on a scale of 1 to 5. The resulting data is shown in the table below.
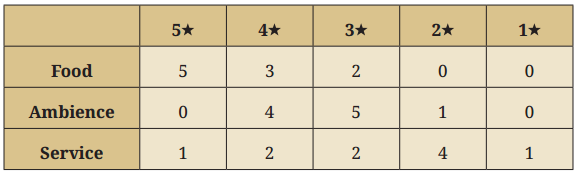
What is the average rating if the metrics are combined with the weights food: ambience : service = 6: 5: 4? ‘
Solution:
First, calculate the average rating score for each category individually using the data table for 10 customers:
Average Food Rating
= \(\frac{(5 \times 5)+(4 \times 3)+(3 \times 2)+(2 \times 0)+(1 \times 0)}{10}\)
= \(\frac{25+12+6+0+0}{10}=\frac{43}{10}\) = 4.3
Average Ambience Rating
= \(\frac{(5 \times 0)+(4 \times 4)+(3 \times 5)+(2 \times 1)+(1 \times 0)}{10}\)
= \(\frac{0+16+15+2+0}{10}=\frac{33}{10}\) = 3.3
Average Service Rating
= \(\frac{(5 \times 1)+(4 \times 2)+(3 \times 2)+(2 \times 4)+(1 \times 1)}{10}\)
= \(\frac{5+8+6+8+1}{10}=\frac{28}{10}\) = 2.8
Now, combine the metric averages using the weights 6:5:4.
Combined Average Rating
= \(\frac{(4.3 \times 6)+(3.3 \times 5)+(2.8 \times 4)}{6+5+4}\)
= \(\frac{25.8+16.5+11.2}{15}=\frac{53.5}{15}=\frac{107}{30}\) = 3.57
Therefore, the average overall rating for the restaurant is 3.57.
Question 7.
The following table shows the weight data of langurs in an animal facility. Without doing any computations, can you tell whether there are more male langurs or more female langurs? Or are they equal in number?
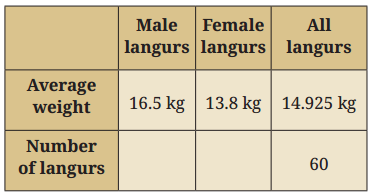
(i) Which of the following expression(s) describes the given scenario?
(a) \(\frac{16.5 x+13.8 y}{x+y}\) = 14.925
(b) \(\frac{16.5 x+13.8 y}{60}\) = – 14.925
(c) \(\frac{16.5 x+13.8 y}{2}\) = – 14.925
(d) \(\frac{16.5 x+13.8 y}{16.5+13.8}\) = – 14.925
Solution:
The overall average weight of all langurs is 14.925 kg. The midpoint between the male average weight of 16.5 kg and the female average weight of 13.8 kg is:
\(\frac{16.5+13.8}{2}\) = 15.15 kg
Since the overall average (14.925 kg) is lower than 15.15 kg, it is pulled closer to the female average weight (13.8 kg). Therefore, there are more female langurs than male langurs.
(i) Let x be the number of male langurs and y be the number of female langurs.
The total weight of all langurs divided by the total count gives the average weight = \(\frac{16.5 x+13.8 y}{x+y}\) = 14.925
Therefore, option (a) is the standard definition of weighted average.
(ii) Find out how many male langurs are present.
Solution:
Using x + y = 60, we have y = 60 – x. Substituting into the equation:
⇒ \(\frac{16.5 x+13.8(60-x)}{60}\) = 14.925
⇒ 16.5x + 828 – 13.8x = 14.925 × 60
⇒ 2.7x + 828 = 895.5
⇒ 2.7x = 67.5
⇒ x = \(\frac{67.5}{2.7}\) = 25
There are 25 male langurs.
(iii) A female langur weighing 15.2 kg is admitted to the facility. What is the average weight of the female langurs after this?
Solution:
Number of female langurs = 60 – 25 = 35
Total weight of initial 35 female langurs
Weight of new female langur added = 15.2 kg.
New total weight = 483 + 15.2 = 498.2 kg.
New count of female langurs = 36.
New average weight of female langurs
= \(\frac{498.2}{36}\) ≈ 13.84 kg
(iv) Two male langurs weighing 16.9 kg and 16.1 kg are released from the facility. What is the average weight of the male langurs after this?
Solution:
Total weight of initial 25 male langurs = 25 × 16.5
= 412.5 kg.
Two males were released, weighing 16.9 kg and 16.1 kg (Total released = 33 kg).
New total weight of male langurs = 412.5 – 33
= 379.5 kg.
New count of male langurs = 23.
New average weight of male langurs
= \(\frac{379.5}{23}\) ≈ 16.50 kg
(v) Now, suppose one of the male langurs lost 1 kg of weight. What is the average weight of all the male langurs after this?
Solution:
One male langur loses 1 kg.
Total weight of the remaining 23 = 379.5 – 1 = 378.5 kg.
New average weight of 23 males
= \(\frac{378.5}{23}\) ≈ 16.46 kg
Question 8.
Dorjee has collected 1 litre of water from the Dead Sea! Using the information in the table, answer the following questions. A calculator can be used if necessary
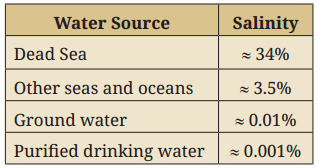
(i) What is the salinity of the mixture if he mixes 1 litre of water from the Dead Sea with 2 litres of purifid drinking water?
Solution:
Salinity of Dead Sea water = 34%
Salinity of purified drinking water = 0.001%
Amount of salt in 1 litre of Dead Sea water = 0.34 litres.
Amount of salt in 2 litres of purified water = 2 × 0.00001 = 0.00002 litres.
Total salt in 3 litres mixture = 0.34002 litres.
Salinity of Mixture = \(\frac{0.34002}{3}\) × 100% = 11.334%
(ii) Is it possible to mix water from the Dead Sea and purifid drinking water to get a mixture with the salinity of groundwater? Why/Why not? What quantity of purifid drinking water should Dorjee mix with 1 litre of water from the Dead Sea to get a mixture having the salinity of groundwater?
Solution:
Yes, it is possible because the target salinity of groundwater (0.01%) lies between the salinity of Dead Sea water (34%) and purified drinking water (0.001 %). Let V litres of purified drinking water be mixed with 1 litre of Dead Sea water:
⇒ \(\frac{1 \times 34+V \times 0.001}{1+V}\) = 0.01
⇒ 34 + 0.001V = 0.01(1 + V)
⇒ 34 + 0.001V = 0.01 +0.01V
⇒ 33.99 = 0.009V
⇒ V = \(\frac{33.99}{0.009}\) = 3776.67 litres
Dorjee needs to mix 3776.67 litres of purified drinking water.
(iii) Is it possible to mix water from the Dead Sea and groundwater to get a mixture with the salinity of purifid drinking water? Why/Why not? What quantity of groundwater should he mix with 1 litre of water from the Dead Sea to get a mixture having the salinity of purifid drinking water?
Solution:
No, it is not possible because both Dead Sea water (34%) and groundwater (0.01%) have a salinity higher than purified drinking water (0.001 %). Mixing two solutions can only yield a concentration strictly between their individual concentrations, so a lower salinity of 0.001% cannot be achieved.
Ex 10.4 Class 9 Ganita Manjari Solutions – Ganita Manjari Class 9 Exercise 10.4 Solutions
Exercise 10.4 Class 9 Ganita Manjari Solutions – Ganita Manjari Class 9 Ex 10.4 Solutions
Question 1.
The following stacked column chart shows the number of animal species in the IUCN Red List, by class, over time.
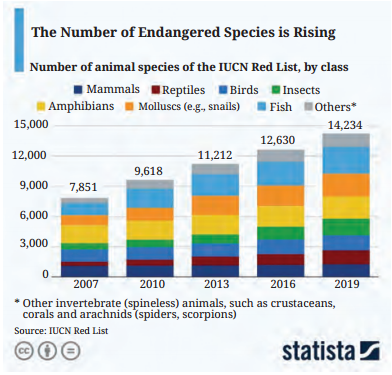
(i) What does the number 14,234 on the top of the column 2019 represent?
(ii) Approximately how many reptile species were in the list in 2016?
(iii) Which class(es) of species have seen a relatively small increase in count between 2007 and 2019?
Solution:
(i) The number 14,234 on the top of the column for the year 2019 represents the total number of endangered animal species listed in the IUCN Red List across all given classes in 2019.
(ii) By observing the segment representing Reptiles in the stacked column for the year 2016, the top boundary of the segment is at approximately 2000 and the bottom boundary is at approximately 1000. Subtracting the lower bound from the upper bound gives:
Number of Reptile species in 2016 ≈ 2000 – 1000
= 1000
Thus, approximately 1000 reptile species were on the list in 2016.
(iii) Comparing the thickness/height of each coloured segment between the 2007 column and the 2019 column shows that Birds and Mammals have maintained almost uniform segment heights, indicating a relatively small increase in count over this period compared to other classes like Fish or Insects.
Question 2.

The wickets taken by a bowler in International Cricket matches till 2025 are shown in the table. Complete the given stacked bar chart (the bar lengths can be approximate),
(i) comparing the total wickets taken at home vs. overseas:
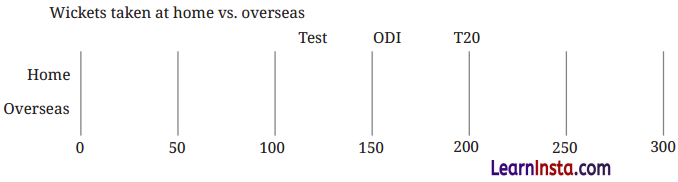
(ii) The total wickets taken in each format:
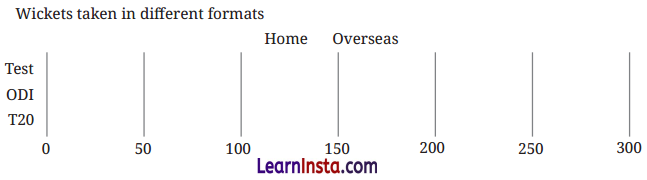
Solution:
From the given data table, the distribution of wickets taken by the bowler is as follows:
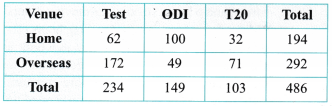
(i) Stacked bar chart comparing the total wickets taken at home vs. overseas:
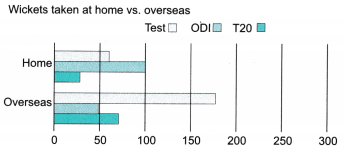
(ii) Stacked bar chart showing the total wickets taken in each format
Ex 10.5 Class 9 Ganita Manjari Solutions – Ganita Manjari Class 9 Exercise 10.5 Solutions
Exercise 10.5 Class 9 Ganita Manjari Solutions – Ganita Manjari Class 9 Ex 10.5 Solutions
Question 1.
The smart watch data of 5 people was tracked from Monday to Friday. The recorded data tells us how many hours each person spent lying down, sitting, and standing or moving around, etc., as shown in the following table. Table 10.3: Average number of hours spent per day Monday-Friday) lying down, sitting, and standing or moving around, etc., of 5 people
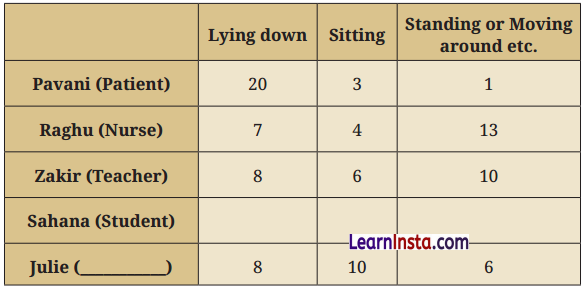
(i) How much time does Sahana spend per day in each of these body-states? Make a reasonable guess and fill her row in the table.
(ii) Guess what activity or.work Julie could be engaged in based on the data. Find out what your classmates’ guesses are.
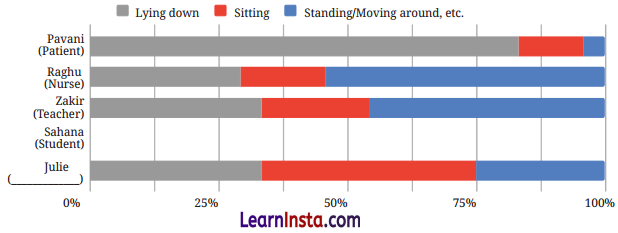
(iii) Complete the chart below based on the tabular data.
Solution:
(Answer may vary)
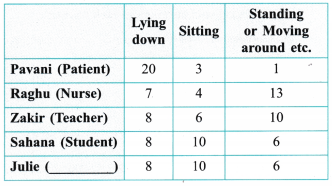
(i) Estimate and fill the row for Sahana (Student)
A typical school student spends approximately 8 hours sleeping (lying down), around 10 hours sitting (attending classes, studying, commuting, and watching TV), and around 6 hours standing or moving around throughout the day.
Since the total number of hours in a day is 24, a reasonable estimation for Sahana’s row in Table 10.3 is:
(ii) Guess Julie’s occupation or activity
Julie spends 8 hours lying down (sleeping), 10 hours sitting, and 6 hours standing or moving around.
Since a major portion of her waking hours (10 hours) is spent sitting, Julie likely works in a desk job or a sedentary profession. Possible occupations for Julie include an IT professional/software engineer, office clerk/desk worker, accountant, or writer/editor.
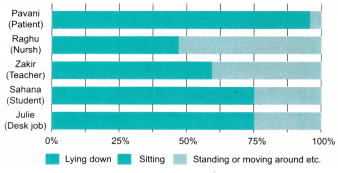
(iii) To complete the 100% stacked bar chart, calculate the percentage of time spent in each body-state for each person (out of 24 hours per day):
Percentage = \(\left(\frac{\text { Hours spent in body-state }}{24}\right)\) × 100%
Sahana (Student):
Lying down: \(\frac{8}{24}\) × 100 = 33.33%
(bar segment from 0% to 33.33%)
Sitting: \(\frac{10}{24}\) × 100 = 41.67% 24
(bar segment from 33.33% to 75%)
Standing/Moving: \(\frac{6}{24}\) × 100 = 25%
(bar segment from 75% to 100%)
Ganita Manjari Class 9 Maths Chapter 10 End of Chapter Exercise Solutions
How Quantities Combine Understanding Data End of Chapter Exercise Solutions
Question 1.
In cricket, the run rate is the- average number of runs scored per over. In a T20 match, a team scored 6 runs in the first over making the run rate 6.
(i) In the second over they scored 12 runs. What is the run rate now?
Solution:
Runs in Over 1 = 6
Runs in Over 2 = 12
Total runs in 2 overs = 6 + 12 = 18
Run rate = \(\frac{\text { Total Runs }}{\text { Total Overs }}=\frac{18}{2}\) = 9 runs per over
(ii) After Over 19, their run rate was 6. What is the run rate after 20 overs given the team made 12 runs in the last over?
Solution:
Total runs after 19 overs = Run rate x Overs
= 6 × 19 = 114 runs
Runs scored in the 20th over = 12
Total runs after 20 overs = 114 + 12 = 126
Run rate after 20 overs = \(\frac{126}{20}\) = 6.3 runs per over
Question 2.
Five friends who play badminton surveyed the city and collected the price of shuttlecocks across brands and types (Nylon and Feather). The following is the list of the prices, in rupees (₹), that each one compiled.
Yusuf: 40(N), 105(N), 383(F), 108(N), 165(F), 116(F)
Srikanth: 194(N), 85(N), 93(N), 121 (N)
Kashvi: 49(N), 297(F), 105(N), 275(F); 40(N)
Prasanna: 124(N), 333(F), 182(N), 258(F)
Gracy: 220(F), 458(F), 129(F), 183(N)
Can you describe a way they can work together to find the average price of a shuttlecock across types?
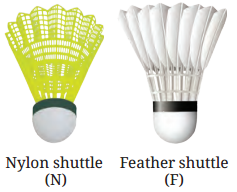
(i) Each one calculated the average of the prices they had gathered. Suppose these are ay, as, ak, ap, ag respectively. Write an expression in that gives the combined average.
Solution:
Let the number of shuttlecock prices collected by Yusuf, Srikanth, Kashvi, Prasanna, and Gracy be ny, ns, nk, np, ng respectively.
Counting from the given list:
ny, ns, nk, np, ng
The total number of observations N = 6 + 4 + 5 + 4 + 4 = 23.
The combined average x is given by the weighted mean expression:
x = \(\frac{n_y a_y+n_s a_s+n_k a_k+n_p a_p+n_g a_g}{n_y+n_s+n_k+n_p+n_g}\)
= \(\frac{6 a_y+4 a_s+5 a_k+4 a_p+4 a_g}{23}\)
(ii) Suppose an, af at are the average prices of the nylon shuttlecocks and the feather shuttlecocks, respectively. Write an expression that gives the average price of a shuttlecock. Will this be equal to the answer we got using the method in the previous part?
Solution:
Let Nn be the total count of nylon shuttlecocks and Nf be the total count of feather shuttlecocks.
Counting from the dataset:
- Nylon shuttlecocks (Nn) = 13
- Feather shuttlecocks (Nf) = 10
The combined average expression is:
x = \(\frac{1}{2}\)
Yes, this value will be exactly equal to the answer obtained in part (i), as both expressions calculate the total sum of all 23 prices divided by 23.
Question 3.
Shreyas holds 25 shares of a company at an average price of ₹ 150 and Vaishnavi holds 5 shares of the same company at an average price of ₹ 150.
(i) Shreyas buys 10 shares of this company at a price of ₹ 30 each. What is the average price per share for him after the purchase?
(ii) Vaishnavi buys some shares of this company at a price of ₹ 30 each and the average price per share for her after the purchase is ₹ 70. How many shares did she buy?
Solution:
(i) Total initial cost of shares = 25 x 150 = ₹ 3750
Additional cost of shares = 10 x 30 = ₹ 300
Total cost of shares = ₹ 3750 + ₹ 300 = ₹ 4050
Total number of shares = 25 + 10 = 35
New average price = \(\frac{4050}{35}\) = ₹ 115.71 per share
(ii) Let the number of shares Vaishnavi buys be x.
Total initial cost of shares = 5 × 150 = 750
Cost of x additional shares = 30x
Total number of shares = 5 + x
Average price per share = ₹ 70:
⇒ \(\frac{750+30 x}{5+x}\) = 70
⇒ 750 + 30x = 70(5 + x)
⇒ 750 + 30x = 350 + 70x
⇒ 400= 40x
⇒ x = 10
Therefore, Vaishnavi bought 10 shares.
Question 4.
(PrthudakasvamI, commentary on Brahmagupta’s Brahmasphutasiddhanta, c. 864 CE) A “hasta” (meaning “forearm”) refers to a unit of length measuring around 18 inches.
A pool 30 hastas long is dug to different depths along its length. It is divided into 5 sections having lengths 4, 5, 6, 7, and 8 hastas, and is dug to depths of 9, 7, 7, 3, and 2 hastas, respectively. Find the mean depth of the pool.
Solution:
Given, lengths (wi) and corresponding depths (xi):
w1 = 4, x1 = 9
w2 = 5, x2 = 7
w3 = 6, x3 = 7
w4 = 7, x4 = 3
w5 = 8, x5 = 2
Total length = 4 + 5 + 6 + 7 + 8 = 30 hastas.
Weighted sum of depths = w1x1 + w2x2 + w3x3 + w4x4
= (4 × 9)+ (5 × 7)+ (6 × 7)+ (7 × 3)+ (8 × 2)
Mean Depth = \(=\frac{w_1 x_1+w_2 x_2+w_3 x_3+w_4 x_4}{w_1+w_2+w_3+w_4}\)
= \(\frac{150}{30}\) = 5 hastas
Question 5.
Suvama had purchased 1 g gold at ₹ 15k (short for ₹ 15,000). This is shown by point O denoting the average price of gold that she possesses. Six different scenarios are given below for her next transaction. For each scenario estimate and mark the average price of gold she will have after the transaction.
(i) Purchase 1 g gold at ₹ 30k
(ii) Purchase 2g gold at ₹ 30k
(iii) Purchase 1 g gold at ₹ 10k
(iv) Purchase 10 g gold at ₹ 10k
(v) Purchase 0.5 g gold at ₹ 30k
(vi) Purchase 0.5 g gold at ₹ 15k
Solution:
Initial state: Suvama holds 1 g gold at ₹ 15k (Point O = 15).
Solution for each transaction:
(i) Purchase 1 g gold at ₹ 30k:
New average = \(\frac{(1 \times 15)+(1 \times 30)}{1+1}=\frac{45}{2}\) = 22.5k
(Point A: 22.5)
(ii) Purchase 2 g gold at ₹ 30k:
New average = \(\frac{(1 \times 15)+(2 \times 30)}{1+2}=\frac{75}{3}\) = 25k
(Point B: 25)
(iii) Purchase 1 g gold at ₹ 10k
New average = \(\frac{(1 \times 15)+(1 \times 10)}{1+1}=\frac{25}{2}\) = 12.5k
(Point C: 12.5)
(iv) Purchase 10 g gold at ₹ 10k
New average = \(\frac{(1 \times 15)+(10 \times 10)}{1+10}=\frac{115}{11}\) = 10.45k
(Point D: 10.45)
(v) Purchase 0.5g gold at ₹ 30k:
New average = \(\frac{(1 \times 15)+(0.5 \times 30)}{1+0.5}\)
= \(\frac{15+15}{1.5}=\frac{30}{1.5}\) = 20k (Point E: 20)
(vi) Purchase 0.5g gold at ₹ 15k:
New average = \(\frac{(1 \times 15)+(0.5 \times 15)}{1+0.5}=\frac{22.5}{1.5}\) = 15k
(Point F: 15)

Question 6.
Given some data with corresponding weights, how would the weighted average change if all the weights are doubled? If required, experiment with some data. What do you observe? Justify your answer using algebra.
Solution:
Let data values be x1; x2, …, xn with initial weights w1, w2,…, wn.
Initial weighted average x = \(\frac{w_1 x_1+w_2 x_2+\ldots+w_n x_n}{w_1+w_2+\ldots+w_n}\)
If all weights are doubled, new weights w’ = 2w
New weighted average x’ = \(\frac{2 w_1 x_1+2 w_2 x_2+\ldots+2 w_n x_n}{2 w_1+2 w_2+\ldots+2 w_n}\)
= \(\frac{2\left(w_1 x_1+w_2 x_2+\ldots+w_n x_n\right)}{2\left(w_1+w_2+\ldots+w_n\right)}\)
= \(\frac{w_1 x_1+w_2 x_2+\ldots+w_n x_n}{w_1+w_2+\ldots+w_n}\) = x
Conclusion: The weighted average remains unchanged when all weights are multiplied by a constant factor.
Question 7.
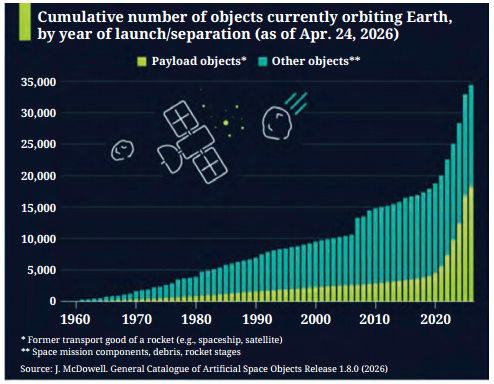
Answer the following questions based on the graph.
(i) In 2003, approximately how many total objects were found orbiting Earth in space? In what year did this number double?
Solution:
From the graph, the total number of objects were found orbiting Earth in space in 2003 approximately 10,000. Double this quantity = 20,000.
The curve touches 20,000 around the year 2021.
(ii) Find the approximate number and share of payload objects and other objects in the year 2025.
Solution:
- Total objects in 2025 are approximately 33,000.
- Payload objects (lower green bar portion) are approximately 17,000.
- Other objects (upper blue portion) are approximately 16,000.
Share of payload objects
= \(\frac{17,000}{33,000}\) x 100 = 51.51%
Share of other objects
= \(\frac{16,000}{33,000}\) x 100 = 48.48%
(iii) What can you say about the number of payload objects over time, and the number of other objects over time? What can you say about the share of payload objects over time, and the share of other objects over time?
Solution:
Both payload objects and other objects have increased exponentially in absolute number over time.
The share of other objects grew rapidly post-1970 and dominates the total count, though recent years show a sharp growth in satellite payloads.
Question 8.
Observe the following infographic.
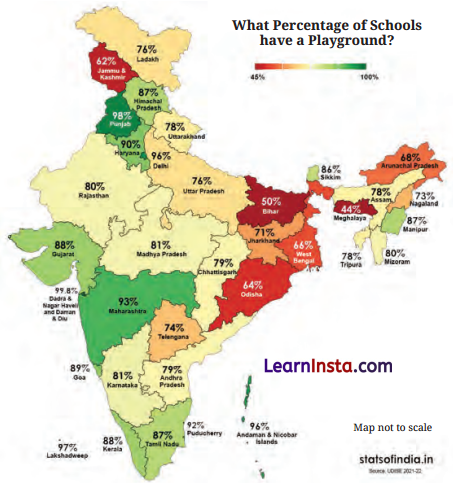
(i) Identify the correct inference(s) from the statements given.
(a) More schools have a playground in Haryana compared to Uttarakhand.
(b) Approximately every 2 out of 3 schools in Arunachal Pradesh have a playground.
(c) Punjab has the highest number of schools with a playground.
(d) Suppose it is given that Maharashtra has more schools than Telangana. Then the number of schools having a playground is more in Maharashtra.
Solution:
(a) Incorrect: The map shows Haryana (90%) and Uttarakhand (78%), but total school counts are unknown.
(b) Correct: Arunachal Pradesh is marked at 68%,
which is approximately
(c) Incorrect: Punjab has a high percentage (98%), but total numbers are not given.
(d) Correct: If Maharashtra has more total schools than Telangana, then 93% of Maharashtra’s total gives a larger absolute number than 74% of Telangana’s smaller total.
(ii) Using the information given, can we find the nation-wide percentage of schools with a playground? If not, what additional information is needed?
Solution:
No, to compute the overall nation-wide percentage, the total number of schools in each individual state/ union territory is required as weights to compute the weighted average.
Question 9.
Decision Dilemma:
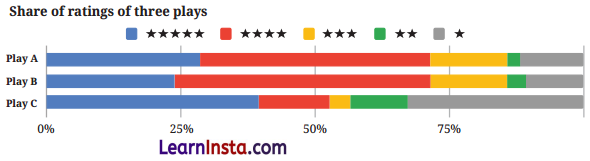
(i) Which of the plays would you choose to watch based on the following chart?
Solution:
Play C, because it has the highest proportion of 5-star ratings (around 40%) compared to Plays A and B.
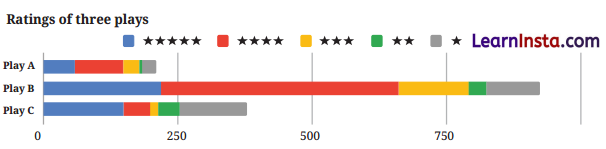
(ii) The corresponding stacked bar chart is shown below. Would you change your decision after looking at this chart? Why/ Why not? Discuss
Solution:
Yes. Looking at the absolute stacked bar chart, Play B has been rated by a vastly larger number of total audience members (over 800 ratings) with an overwhelming majority giving 4 and 5 stars. Plays A and C have very few total reviews (approx 200 and approx 400), making Play B’s high rating significantly more reliable.
Question 10.
A triathlon is an endurance race consisting of swimming 3.8 km, cycling 180 km, and running 42.2 km, Athletes compete for the fastest overall time, completing each segment in that order. The following table shows finish time of 3 athletes in each segment.
Table 10.4: Finish time of three athletes in each segment of a triathlon race (values in hh : mm)
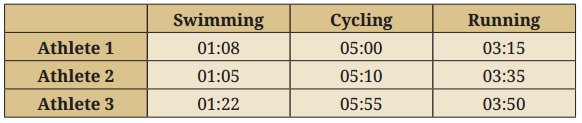
(i) What is a suitable representation of this data – a stacked bar chart or a 100% stacked bar chart? Why do you think so?
(ii) Suppose a 100% stacked bar chart is drawn. Which of the following question(s) can be answered by looking at just that chart?
(a) Who finished the race first?
(b) Approximately what fraction of their race time did Athlete 1 spend cycling?
(c) Which athlete took the longest for running?
Solution:
(i) A stacked bar chart is more suitable because the primary objective in a triathlon is the total finish time (fastest total time wins). A stacked bar chart directly displays total duration via total bar length.
(ii) (a) No, overall totals are hidden.
(b) Yes, 100% stacked bars display proportions directly.
(c) No, actual segment times are not shown without total values.
Only (b) can be answered by looking the chart.
Question 11.
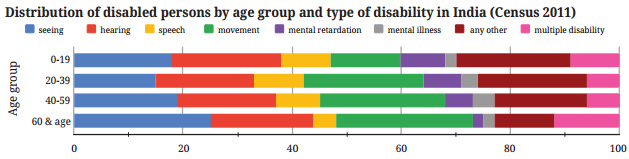
Look at the following graph. What do you notice? What do you wonder? Write your inferences.
Solution:
Inferences from Census 2011 Disability Chart:
1. Movement Disability: Increases significantly with age, becoming the largest proportion in the 40-59 and 60+ age categories.
2. Seeing & Hearing Disabilities: Proportions are highest among the elderly (60+ group).
3. Mental Retardation/Illness & Speech: Represent higher proportions in younger age groups (0-19 and 20-39) compared to older age groups.
Question 12.
Individual project: Do at least one of the following.
(i) Recall the previous day and fill in the approximate time spent lying down, sitting, and standing/moving around, etc.
Ask at least 2 of your family members about their day and fill it in. Alternatively, you can choose to track just your own body-state for any one of the weekdays, Saturday, and Sunday. Visualise it using a stacked bar chart. Discuss with your class how you arrived at the estimated time spent in each state.
(ii) Visualise your family’s monthly expenditure using a 100% stacked bar chart.
(a) First, identify the expense categories in your family budget.
(b) Discuss with your family members to decide how you will collect and organise the data.
(c) Collect expense data for at least 3 months.
(d) Represent the data in a 100% stacked bar chart with each bar showing how the total monthly expenditure is divided across the different categories.
(e) Finally, write your observations and inferences based on the chart.
Solution:
Do it yourself
Question 13.
Small-group project: Make a group of 3-4 students. Choose one scenario to design a custom rating scheme by assigning appropriate weights:
(a) shopping experience at a cloth store,
(b) travel experience in a bus,
(c) tourism experience of a nearby tourist spot,
(d) clinic/hospital experience
(i) Discuss and arrive at 4-6 aspects to rate. For each aspect chosen, justify why it matters for an overall experience.
(ii) Discuss and decide the relative weights and justify.
(iii) Collect or imagine ratings from at least 10 people on a scale of 1-5 (5 being very good).
(iv) Compute each individual rating. Compute the overall average across individuals.
(v) Make a 100% stacked bar chart using your data.
(vi) Write a short note on the observations and inferences, what your rating system captures well and what it misses.
Solution:
Do it yourself
Question 14.
Whole class project: Each student shares the average age of their family and the number of family members. Discuss among the class and come up with a way to find out the average age of all the families of the class.
Solution:
Do it yourself
Question 15.
Given some data with corresponding weights, what would happen to the weighted average if all the weights are increased by a constant value, say 1? If required, experiment with some data. What do you observe? Justify your answer using algebra.
Solution:
Let the original values be x1; x2,…, xn with weights w1, w2, …, wn respectively.
Initial weighted mean x = \(\frac{w_1 x_1+w_2 x_2+\ldots+w_n x_n}{w_1+w_2+\ldots+w_n}\)
If each weight becomes w’ = w1 + c, the new weighted mean x’ is:
x = \(=\frac{\left(w_1+c\right) x_1+\left(w_2+c\right) x_2+\ldots+\left(w_n+c\right) x_n}{\left(w_1+c\right)+\left(w_1+c\right)+\ldots+\left(w_n+c\right)}\)
= \(=\frac{\left(w_1 x_1+w_2 x_2+\ldots+w_n x_n\right) x_n+c\left(x_1+x_2+\ldots+x_n\right)}{\left(w_1+w_2+\ldots+w_n\right)+n c}\)
This expression does not simplify back to x unless all x, are equal. The new weighted mean shifts closer to the simple arithmetic mean xsimple = \(\frac{x_1+x_2+\ldots+x_n}{n}\), because adding a constant weight reduces the relative percentage difference between weights.
Let’s take a simple data set with values (xi) and initial weights (wi):
| Data Point (xi) | Initial weight (wi) |
| 10 | 1 |
| 20 | 2 |
| 30 | 3 |
New Weighted Average (Increasing each weight by c = 1)
Now, add 1 to each (wi’ = w2 + 1) weight:
| Data Point (xi) | New weight (wi’ = w2 + 1) |
| 10 | 1 + 1 = 2 |
| 20 | 2 + 1 = 3 |
| 30 | 3 + 1 = 4 |
New average = \(\frac{(2 \times 10)+(3 \times 20)+(4 \times 30)}{2+3+4}\)
= \(\frac{20+60+120}{9}=\frac{200}{9}\) = 22.22
Arithmetic mean = \(\frac{10+20+30}{3}\) = 20.
Observation: When each weight is increased by 1, the weighted average changes from 23.33 to 22.22 and move closer to the arithmetic mean of the data value, which is 20,. This shows that increasing all weight by the same constant reduces the effect of the original difference between the weights.
Question 16.
A farm has some cows, sheep, and chickens. Last year the cows made up 60%, the sheep 25%, and the chickens 15%. There was a decrease in the number of all three animals’ population over the year. Choose the possibilities for the change in their respective shares of the population
(i) % of cows decreased, % of sheep decreased, % of chickens decreased
(ii) % of cows increased, % of sheep increased, % of chickens increased the same, % of chickens remained the same
(iv) % of cows decreased, % of sheep increased, % of chickens remained the same
(v) % of cows increased, % of sheep increased, % of chickens decreased.
Solution:
Let the initial percentages of cows, sheep, and chickens be 60%, 25%, and 15% respectively, such that their sum is 100%.
Since the total share of all three animal populations must always sum to 100%, any change in individual shares must sum to zero (∆C + ∆S + ∆K = 0%).
(i) Incorrect: The percentage shares of all three animals cannot decrease simultaneously, as the sum would become less than 100%.
(ii) Incorrect: The percentage shares of all three animals cannot increase simultaneously, as the sum would exceed 100%.
(iii) Correct: If the population of all three animals decreases in the exact same proportion, their percentage shares remain unchanged.
(iv) Correct: A decrease in the share of cows can be balanced by an equal increase in the share of sheep while the share of chickens remains constant.
(v) Correct: Increases in the shares of both cows and sheep can be balanced by a sufficient decrease in the share’ of chickens.