Experts have designed these Class 9 Maths Notes and Chapter 7 The Mathematics of Maybe Introduction to Probability Class 9 Ganita Manjari Notes for effective learning.
Class 9 Maths Chapter 7 The Mathematics of Maybe Introduction to Probability Notes
Class 9 Maths Ganita Manjari Chapter 7 Notes
Ganita Manjari Class 9 Chapter 7 Notes – Class 9 The Mathematics of Maybe Introduction to Probability Note
In this chapter, we will introduce the concept of probability and understand randomness through experiments and data. We will study theoretical and empirical probability, sample space and events and also learn to compute probabilities using tables and tree diagrams. The chapter also develops analytical thinking by applying probability to real-life situations.
Probability: Probability is the study of the chances of events happening. For understanding the concept of probability we have to know some basic terms related to it.
Some Basic Terms
Experiment or Trial
An operation which can produce some well-defined outcomes, is called an experiment or trial.
e.g. If a coin is tossed 20 times then each toss is called an experiment or a trial and we get either head or tail as a result. Here, head and tail are called outcomes.
The experiment can be divided into two types, which are given below.
1. Random Experiment An experiment, when repeated under identical conditions, does not produce the same outcome every time but the outcomes produced are one out of the several possible outcomes is known as a random or a probabilistic experiment.
e.g. Tossing a fair coin is a random experiment because if we toss a coin then either a head or tail will come up but if we toss a coin again and again then the outcome each time will not be same but it will sure be either head or tail.
2. Deterministic Experiment An experiment, when repeated under identical conditions, produce the same result or outcomes, is known as deterministic experiment.
e.g. Tossing an unfair coin having either tail or head on both sides 20 times, we get the same result.
Sample Space (S):
The sample space is the complete set of all possible outcomes of a random experiment. Each outcome is called an element of the sample space. Every possible outcome must be included once and only once. The number of elements in the sample space is called its size, denoted by n(S).
e.g. When two coins are tossed together, the possible outcomes are Head-Head (HH), Head-Tail (HT), Tail-Head (TH) and Tail-Tail (TT).
So, the sample space is S = {HH, HT,TH, TT} and hence n(S) = 4.
![]()
Event
A possible outcome or combination of outcomes of a random experiment is called an event, e.g. Getting head in the toss of a coin is an event.
Occurrence of an Event
An event E associated with a random experiment is said to be occur (or happen) in a trial, if the outcome of trial is one of the outcomes that favours E. e.g. If a die is rolled and the outcome of a trial is 4 then we say that each of the following events has happened (or occurred)
(i) getting an even number.
(ii) getting a number greater than 2.
(iii) getting a number less than 5.
Elementary Event
An event having only one outcome of the random experiment is called an elementary event, e.g. In tossing a coin, the possible outcomes are Head (H) and Tail (T).
Therefore, if we define
E1 = Getting head (H ) on the upper face of the coin and
E2 = Getting tail (T) on the upper face of the coin. Then, E1 and E2 are elementary events associated with the random experiment of tossing a coin.
Compound Event
A collection of two or more elementary events
associated with a random experiment is called a compound event.
e.g. In the random experiment of tossing of two coins simultaneously, if we define the event getting exactly one head then it is a collection of elementary events (or outcomes) HT and TH.
So, it is a compound event.
Likelihood of an Event (Probability Scale)
Probability measures how likely an event is to occur and takes values between 0 and 1. A probability of 0 indicates an impossible event, while a probability of 1 indicates a certain event. A probability of 0.5 represents an even chance i.e. the event is equally likely to occur or not occur. Values between 0 and 0.5 indicate that an event is less likely and values between 0.5 and 1 indicate that an event is more likely.
Thus, the probability scale is
| 0 | Impossible |
| 0.25 | Loss likely |
| 0.5 | Even chance |
| 0.75 | Most likely |
| 1 | Certain |
All probabilities lie between 0 and 1 and show different degrees of likelihood.
Here are a few examples of events and the probabilities of their occurrence.
| Event | What it means |
| Getting a number 8 on a standard die | Impossible A die has numbers only from 1 to 6. |
| Picking a black ball from a bag containing 1 black and 5 white balls | Less likely Only one black ball is present out of total balls. |
| Selecting a vowel from the letters A, B, C, D, E | Even chance There are 2 vowels (A, E) and 3 consonants, so chance are close but not equal, making it moderate likelihood. |
| Choosing a month with 31 days | More likely There are 7 such months out of 12. |
| The sun rising in the East | Certain This event always happens. |
Probability – An Experimental Approach
If E is an event that happen when an experiment is performed then the experimental or empirical probability of an event E is given by
Number of trials in which eventE has happened
P(E) = \(\frac{\text { Number of trials in which event } E \text { has happened }}{\text { Total number of trials }}\)
or
P(E) = \(\frac{\text { Number of times in which event } E \text { has occurred }}{\text { Number of times the experiment has performed }}\)
Number of times the experiment has performed
The empirical probability depends on the number of trials under taken and the number of times the outcomes you are looking for coming up in the trials.
In other words, percentage of occurrence or non-occurrence of an event is called the probability, e.g. If a coin is tossed 1000 times and event E1 – Head occurs 455 times and event E2 – Tail occurs 545 times then probability of occurrence of head,
P(E1) = \(\frac{455}{1000}\) = 0.455
and probability of occurrence of tail,
P(E2) = \(\frac{545}{1000}\) = o.545
Some Important Points
- The probability of happening of an event always lies from 0 to 1 i.e. 0 ≤ P(E) ≤ 1.
- In percentage, it lies from 0% to 100%.
- If probability of an event say A is 1 i.e. P(A) = 1 then event A is called a certain event or sure event.
- The sum of all the probabilities of all possible outcomes of an experiment is 1
i.e. P(E) +P (not E) = 1 or P(E) = 1 – P (not E) or P (not E) = 1 – P(E) - If probability of an event say B is 0 i.e. P(B) =0 then event B is called an impossible event.
- Experimental probability of an event can never be negative.
Example 1.
Two coins are tossed simultaneously 300 times and it is found that two heads appeared 135 times, one head appeared 111 times and no head appeared 54 times. If two coins are tossed at random, what is the probability of getting
(i) 2 heads?
(ii) 1 head?
(iii) 0 head?
Solution:
Here, two coins are tossed simultaneously 300 times.
So, total number of trials = 300
(i) Let E1 be the event of getting 2 heads appeared 135 times.
∴ Number of trials in which 2 heads occur = 135
Hence, probability of getting 2 heads,
P(E1) = \(\frac{135}{300}\) = 0.45
(ii) Let E2 be the event of getting 1 head appeared 111 times.
∴ Number of trials in which 1 head occur = 111 Hence, probability of getting 1 head,
P(E3) = \(\frac{111}{300}\) = 0.37
(iii) LetE, be the event of getting 0 head (no head) appeared 54 times.
∴ Number of trials in which 0 head occur =54 Hence, probability of getting 0 head,
P(E3) = \(\frac{54}{300}\) = 0.18
Note:
If we toss two coins then we get either 2 heads or 0 tail, 1 head or 1 tail, 0 head or 2 tails. So, probabilities of all possible outcomes in above example are calculated. Now, sum of all probabilities = 0.45 + 0.37 + 0.18 = 1.
![]()
Example 2.
The percentage of marks obtained by a student in the monthly unit tests are given below.
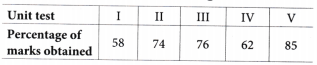
Find the probability that the student gets,
(i) a first class i.e. atleast 60% marks.
(ii) marks between 70% and 80%.
(iii) a distinction i.e. 75% or above.
(iv) less than 65% marks.
Solution:
Given, total number of unit tests held = 5
(i) Number of unit tests in which the student gets a first class i.e. atleast 60% marks = 4
∴ Probability that the student gets a first class = \(\frac{4{5}\) =0.8
(ii) Number of unit tests in which the student gets marks between 70% and 80% =2
∴ Probability that the student gets marks between 70% and 80% = \(\frac{2}{25}\) =0.4 5
(iii) Number of unit tests in which the student gets distinction or marks equal and more than 75% = 2
∴ Probability that the student gets distinction = \(\frac{2}{5}\) = 0.4
(iv) Number of unit tests in which the student gets less than 65% marks = 2
∴ Probability that the student gets less than 65% marks = \(\frac{2}{5}\) = 0.4
Example 3.
A die is thrown 250 times and the outcomes are noted as given below.
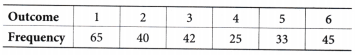
If a die is thrown at random then find the probability of getting
(i) 1
(ii) 2
(iii) 3
(iv) 4
(v) 5
(vi) 6
Solution:
Here, a die is thrown 250 times. So, total number of trials = 250
In a random throw of a die, let E1, E2 , E3, E4 , E5 and E6 be the events of getting 1, 2, 3, 4, 5 and 6, respectively.
(i) Here, frequency of outcome 1 is 65 i.e. 1 occurs on a die 65 times.
∴ p(getting 1) = p(E1) = \(\frac{\text { Number of times } 1 \text { occurs }}{\text { Total number of trials }}\)
= \(\frac{65}{250}\) = 0.26
(ii) Here, 2 occurs on a die 40 times.
∴P(getting 2) = P(E2)
= \(\frac{\text { Number of times } 2 \text { occurs }}{\text { Total number of trials }}\)
= \(\frac{40}{250}\) = 0.16
(iii) Here, 3 occurs on a die 42 times.
∴P(getting 3) = P(E3)
= \(\frac{\text { Number of times } 3 \text { occurs }}{\text { Total number of trials }}\)
= \(\frac{42}{250}\) = 0.168
(iv) here, 4 occurs on a die 25 times.
∴P (getting 4) = P(E4)
= \(\frac{\text { Number of times } 4 \text { occurs }}{\text { Total number of trials }}\)
= \(\frac{25}{250}\) = 0.10
(v) Here, 5 occurs on a die 33 times.
∴P (getting 5) = P(E5)
= \(\frac{\text { Number of times } 5 \text { occurs }}{\text { Total number of trials }}\)
= \(\frac{33}{250}\) = 0.132
(vi) Here, 6 occurs on a dic 45 limes
∴P (getting 6) = P(E6)
= \(\frac{\text { Number of times } 6 \text { occurs }}{\text { Total number of trials }}\)
= \(\frac{45}{250}\) = 0.18
Example 4.
On one page of a telephone directory, there were 200 telephone numbers. The frequency distribution of their unit place digit (e.g. In the number 25828573, the unit place digit Is 3) is given in table.
im-3
Without looking at the page, the pencil is placed on one of these numbers le. the number is chosen at random. What is the probability that the digit In Its unit place Is 6?
Solution:
Here, 200 telephone numbers are given on one page of a telephone dircctory.
Total number of selected telephone numbers = 200
The frequency of digit 6 at unit place is 14 i.e. in 14 telephone numbers 6 is at unit place.
∴Required probability
= \(\frac{\text { Frequency of } 6}{\text { Total number of selected telephone numbers }}\)
= \(\frac{14}{200}\) = 0.07
Theoretical Definition (Classical Definition) of Probability
Let us assume all the outcomes of an experiment are equally likely and E is an event associated with the experiment then the theoretical probability (or classical probability) of the event E is given by
P(E) = \(\frac{\text { Number of outcomes favourable to } E}{\text { Total number of outcomes }}\)
Analysing Statistical Data Using Probability
The way of collecting evidence through statistical data is used extensively in the world of business for marketing, forecasting sales, insurances and in science and social science research.
e.g. Suppose the favourite fruit of 50 students is recorded as follows 20 like mango, 15 like apples, 10 like bananas and 5 like grapes.
If one student is selected at random then
Probability of liking mango = \(\frac{\text { Number of students who like mango }}{\text { Total number of students }}\)
= \(\frac{20}{50}\)
= 0.4
Hence, the probability is 0.4 or 40%, which means there is a 40% chance that a randomly chosen student likes mango.
Note:
In practical situations, collecting data from all individuals is difficult. The complete group is called the population and a smaller part of it is called a sample. Probabilities are often estimated using sample data. This method is known as sampling.
Example 5.
If a die is thrown then find the probability of getting 3.
Solution:
When a die is thrown, there are six possible outcomes i.e. 1, 2, 3, 4, 5, 6.
So, total number of outcomes is 6.
Let E be the event of getting 3.
∴Number of outcome favourable to E = 1 (i.e. 3)
Hence, P(E) = \(\frac{\text { Number of outcomes favourable to } E}{\text { Total number of outcomes }}\)
= \(\frac{1}{6}\)
Tree Diagram (Tree Method)
A tree diagram is a simple and clear way to show all possible outcomes of an experiment that happens in steps. In a multi-step experiment, one action is followed by another and each step can have different results.
In a tree diagram, each branch represents a possible outcome and the branches keep splitting to show all possible paths.
A tree diagram helps in understanding the experiment easily and in listing all outcomes of the sample space in a systematic way.
Example 6.
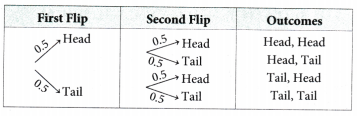
A fair coin is tossed two times. Using the tree diagram method, determine the probability of getting ‘Heads twice’.
Solution:
Consider the experiment of tossing a fair coin two times. From a starting point, we can create a tree diagram, as seen in the provided image. We draw two branches to represent the outcomes of the first toss, namely Head (H) and Tail (T). Now, from each of these outcomes, we again draw two branches for the second toss, giving H and T in each case.
First Toss Second Toss Outcomes
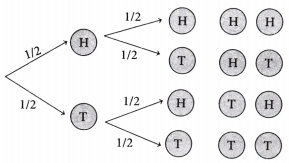
Thus, the possible outcomes are HH, HT, TH and TT, and hence the sample space is S = {HH, HT, TH, TT).
Also, the probability of each outcome can be found using
P = \(\frac{\text { Number of favourable outcomes }}{\text { Number of possible outcomes }}\)
Now, if we consider the event of getting Heads twice, it is represented by 11H. Since, there are 4 possible outcomes and only 1 favourable outcome.
So. the probability of HH is P(HH) = \(\frac{1}{4}\)
= 0.25 = 25%.
Problems Related to Probability of an Event
Let us discuss the procedure of finding probability for the problems of following types.
Type I Problems Based on Tossing a Coin
A coin has two sides, head (H) and tail (T). If we toss one or more coins then their possible outcomes are as follows
(i) In case of one coin, possible outcomes are H and T.
(ii) In case of two coins, possible outcomes are HH, HT, TH, TT.
(iii) In case of three coins, possible outcomes are HHH, HHT, HTH, HTT, THH, THT, TTH, TTT.
When we consider a coin, we assume it to be ‘fair’ meaning that the probability of either outcome (heads or tails) occuring is equal.
There is no preference for the coin to land on heads or tails more frequently, such a coin is called an unbiased coin.
Random toss of a coin It refers to an experiment in which a coin is thrown in such a way that is falls freely without any external influence, ensuring on bias in the outcome.
Tree diagram for a coin tossed twice
Example 7.
Three coins are tossed simultaneously.
Find the probability of getting
(i) exactly two heads.
(ii) atleast two heads.
Solution:
When three coins are tossed simultaneously, then possible outcomes are H, H, H), (H, H, T),(H, T, H),
(T, H, H), (H, T, T), (T, H, T), (T. T, H), (T, T, T))
∴ Total number of outcomes = 8
We know that for an event E.
P(F) = \(\frac{\text { Number of outcomes favourable to } E}{\text { Total number of outcomes }}\)
(i) Let P, be the event of getting exactly two heads. Then, the outcomes favourable to E, are
{(H, H,T), (H, T, H), (T, H, H)}
∴ Number of outcomes favourable to E1 = 3
P(E1) = \(\frac{3}{8}\)
(ii) Let E2 be the event of getting at least two heads i.e. two heads or three heads.
Then, the outcomes favourable to£2 are
{(H, H, T), (H, T, H), (T, H, H), (H, H, H)}
∴ Number of outcomes favourable to E2 = 4
P(E2) = \(\frac{4}{8}=\frac{1}{2}\)
![]()
Type II Problems Based on Throwing a Die
A die has six faces marked as 1, 2, 3, 4, 5 and 6. If we have more than one die then all dice are considered as distinct, unless stated otherwise.
If we throw one die or two dice then their possible outcomes are as ‘follows.
(i) In case of a die, possible outcomes are 1, 2, 3, 4, 5 and 6.
(ii) In case of two dice, possible outcomes are
(1, 1) , (1, 2), (1, 3), (1, 4), (1, 5), (1, 6),
(2, 1), (2, 2), (2, 3) , (2, 4), (2, 5), (2, 6),
(3, 1), (3, 2), (3, 3), (3, 4), (3, 5), (3, 6),
(4, 1), (4, 2), (4, 3), (4, 4), (4, 5), (4, 6),
(5, 1) , (5, 2), (5, 3), (5, 4), (5, 5), (5, 6),
(6, 1), (6, 2), (6, 3) , (6, 4), (6, 5) and (6, 6).
Example 8.
Suppose we throw a die once.
(i) What is the probability of getting a number greater than 2?
(ii) What is the probability of getting a number less than or equal to 5?
Solution:
Possible outcomes of the experiment are 1, 2, 3, 4, 5 and 6.
∴ Total number of outcomes = 6
(i) Let E be the event of getting a number greater than 2.
Then, outcomes favourable to E are 3, 4, 5 and 6.
Number of outcomes favourable to E = 4
∴ P(E) = \(\frac{4}{6}=\frac{2}{3}\)
(ii) Let £ be the event of getting a number less than or equal to 5.
Then, outcomes favourable to Pare 1, 2, 3,4 and 5.
∴ Number of outcomes favourable to E = 5
∴ P(F) = \(\frac{5}{6}\)
Type III Problems Based on Playing Cards
A standard pack of playing cards contains 52 cards, divided into two colours, 26 red cards and 26 black cards. The red cards include 13 hearts (♥) and 13 diamonds (♦), while the black cards include 13 spades (♠) and 13 clubs (♣).
Thus, the 52 cards are grouped into four suits, each having 13 cards as follows.
- Hearts
- Diamonds
- Spades
- Clubs
Each suit consists of cards ace, king, queen, jack, 10, 9, 8, 7, 6, 5, 4, 3 and 2.
Tree Diagram of Playing Cards
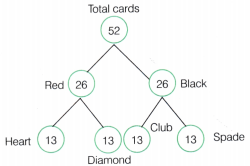
Face Cards King. Queen and Jack are called face cards.
So, total number of face cards = 12
Example 9.
One card is drawn at random from a well-shuffled deck of 52 cards. Find the probability that the card drawn
(i) is a king.
(ii) is not a red card.
Solution:
Total number of cards in one deck = 52
∴ Total number of outcomes = 52
(i) Let E1 be the event of getting a king.
There are 4 kings in a deck of cards.
∴ Number of outcome favourable to E1 = 4
∴ P(E1) = \(\frac{4}{52}=\frac{1}{13}\)
(ii) Let E2 be the event of getting a card that is not a red card.
Total red cards = 26
∴ Number of outcomes favourable to E1 = 52 – 26 = 26
∴ P(E2) = \(\frac{26}{52}=\frac{1}{2}\)
Type IV Problems Based on Selection of an Object from a Bag/Box
In this type of problems, we have to find the probability of selecting an item/object of particular colour/type from a bag/box containing items/objects (like 5 balls, 4 marbles, 8 oranges, 7 bulbs etc.) in more than one colour/type.
Example 10.
A cricket team wins the matches with a probability of 0.6. Using a tree diagram, find the probability that the team wins at least one of their next two matches.
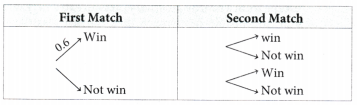
Solution:
Given, P(win) = 0.6 and P(not win) = 1 – 0.6 = 0.4
Now, required probability.
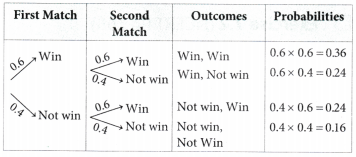
P (at least one win) = P (Win, Win) or P (Win, Not win) or P (Not win, Win)
= P (Win, Win) + P (Win, Not win) + P (Not win, Win)
= (0.6 × 0.6) + (0.6 × 0.4) + (0.4 × 0.6)
= 036 + 024 + 0.24 = 0.84
Example 11.
A box contains 30 discs which are numbered from 1 to 30. If one disc is drawn at random from the box then find the probability that the number on the drawn disc is
(i) a multiple of 5.
(ii) greater than 20.
Solution:
Total number of possible outcomes = 30
(i) Let E be the event of getting a multiple of 5.
Outcomes favourable to £ are 5,10, 15, 20, 25, 30.
Number of favourable outcomes to E = 6
∴ P(E) = \(\frac{\text { Number of outcomes favourable to } E}{\text { Total number of outcomes }}\)
= \(\frac{6}{30}=\frac{1}{5}\)
(ii) Let F be the event of getting a number greater than 20. Favourable outcomes to £ are 21,22, 23, 24, 25, 26, 27, 28, 29, 30.
Number of favourable outcomes = 10
∴ P(E) = \(\frac{10}{30}=\frac{1}{3}\)
Type V Problems Based on Geometry
In this type of problems, a geometrical figure is given to us and we have to find the probability that a given element lies inside the small part of the geometrical figure.
For this, we first find the area/volume of both geometrical figures (small and big) separately and then find the required probability by taking area/volume of small part as number of favourable outcomes and area/volume of whole part as total number of outcomes.
![]()
Example 12.
A missing helicopter is reported to have crashed somewhere in the rectangular region shown in figure. What is the probability that it crashed inside the lake shown in the figure?
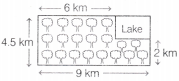
Solution:
Here, the helicopter is equally likely to crash anywhere in the region. The given geometrical figure is a rectangle and its small part i.e. lake is also a rectangle.
For rectangular region, length =9 km and breadth = 4.5 km
Area of entire rectangular region, where the helicopter can crash = 4.5 × 9 = 40.5 km2
For rectangular lake, length = 9 – 6 = 3 km amd breadth = 4.5 – 2 = 2.5 km
∴Area of the lake = 2.5 × 3 = 7.5 km2
Hence, probability that helicopter crashed inside the lake
= \(\frac{\text { Area of favourable region }}{\text { Total area of region }}=\frac{7.5}{40.5}=\frac{75}{405}=\frac{5}{27}\)