Check the below NCERT MCQ Questions for Class 8 Maths Chapter 15 Introduction to graphs with Answers Pdf free download. MCQ Questions for Class 8 Maths with Answers were prepared based on the latest exam pattern. We have provided Introduction to graphs Class 8 Maths MCQs Questions with Answers to help students understand the concept very well.
Students can also refer to NCERT Solutions for Class 8 Maths Chapter 15 Introduction to Graphs for better exam preparation and score more marks.
Class 8 Maths Chapter 15 MCQ With Answers
Maths Class 8 Chapter 15 MCQs On Introduction to graphs
Observe the following bar graph and answer the related questions:
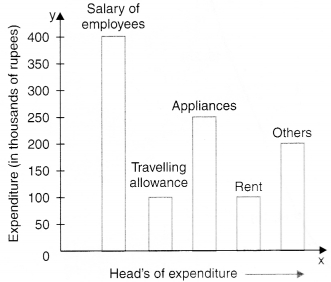
Question 1.
On which head, is the expenditure maximum ?
(a) Travelling allowance
(b) Rent
(c) Appliances
(d) Salary of employees.
Answer
Answer: (d) Salary of employees.
Hint:
The length of the bar corresponding to the head ‘salary of employees’ is maximum.
Question 2.
On which head/heads, is the expenditure minimum ?
(a) Travelling allowance/rent
(b) Appliances
(c) Salary of employees
(d) Others.
Answer
Answer: (a) Travelling allowance/rent
Hint:
The length of the bar corresponding to the head travelling allowance/rent is minimum.
Question 3.
On which two heads, is the expenditure same ?
(a) Salary of employees and others
(b) Travelling allowance and rent
(c) Appliances and rent
(d) Appliances and others.
Answer
Answer: (b) Travelling allowance and rent
Hint:
The lengths of the bars corresponding to the heads travelling allowance and rent are the same.
Question 4.
What is the difference of expenditures (in thousands of rupees) on salary of employees and rent ?
(a) 100
(b) 200
(c) 300
(d) 400.
Answer
Answer: (c) 300
Hint:
400 – 100 = 300
Question 5.
What is the sum of the expenditures (in thousands of rupees) on travelling allowance and rent ?
(a) 100
(b) 200
(c) 300
(d) 400.
Answer
Answer: (b) 200
Hint:
100 + 100 = 200
Observe the following circle-graph and answer the related questions:
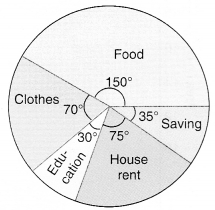
Question 6.
On which head is the expenditure maximum ?
(a) Food
(b) Clothes
(c) House rent
(d) Education.
Answer
Answer: (a) Food
Hint:
The central angle is maximum for food.
Question 7.
On which head is the expenditure minimum ?
(a) Education
(b) House rent
(c) Food
(d) Clothes.
Answer
Answer: (a) Education
Hint:
The central angle is minimum for education.
Question 8.
If the budget of the family is Rs 10800, what is the saving ?
(a) Rs 1050
(b) Rs 1000
(c) Rs 950
(d) Rs 1200.
Answer
Answer: (a) Rs 1050
Hint:
Saving = \(\frac{35}{360}\) × 10800 = 1050.
Question 9.
What is the difference of expenditures on clothes and education if the budget of the family is Rs 10800 ?
(a) Rs 1200
(b) Rs 1000
(c) Rs 800
(d) Rs 1500.
Answer
Answer: (a) Rs 1200
Hint:
70 – 30 = 40
\(\frac{40}{360}\) × 10800 = 1200.
Question 10.
What is the sum of the expenditures on food and education if the budget of the family is Rs 10800 ?
(a) Rs 5000
(b) Rs 8000
(c) Rs 5400
(d) Rs 6000.
Answer
Answer: (c) Rs 5400
Hint:
150 + 30 = 180
\(\frac{180}{360}\) × 10800 = 5400
Observe the following histogram and answer the related questions:
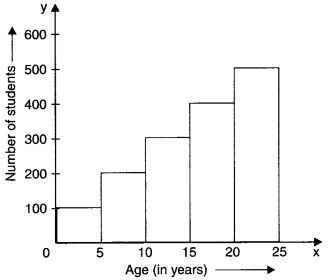
Question 11.
In which class interval, are the maximum number of students ?
(a) 0-5
(b) 5-10
(c) 20-25
(d) 15-20.
Answer
Answer: (c) 20-25
Hint:
The length of the rectangle on 20 – 25 is maximum.
Question 12.
In which class interval, are the minimum number of students ?
(a) 0-5
(b) 5-10
(c) 10-15
(d) 15-20.
Answer
Answer: (a) 0-5
Hint:
The length of the rectangle on 0 – 5 is maximum.
Question 13.
In which class intervals, is the number of students 200 ?
(a) 5-10
(b) 0-5
(c) 20-25
(d) 15-20.
Answer
Answer: (a) 5-10
Hint:
5-10 → 200
Question 14.
The difference in the number of students of class intervals 0-5 and 5-10 is
(a) 100
(b) 200
(c) 300
(d) 400.
Answer
Answer: (a) 100
Hint:
0-5 → 100
5-10 → 200
200-100 = 100
Question 15.
The sum of the number of students in the class intervals 10-15 and 20-25 is
(a) 800
(b) 900
(c) 600
(d) 400.
Answer
Answer: (a) 800
Hint:
10-15 → 300
20-25 → 500
300 + 500 = 800.
Observe the following temperature time graph and answer the related questions:
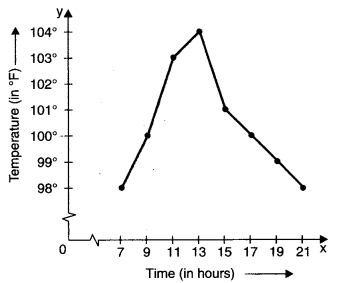
Question 16.
At what time is the temperature maximum ?
(a) 13 hours
(b) 15 hours
(c) 11 hours
(d) 19 hours.
Answer
Answer: (a) 13 hours
Hint:
13 hours → 104°F
Question 17.
At what time(s) is the temperature minimum ?
(a) 7 hours and 21 hours
(b) 9 hours
(c) 11 hours
(d) 13 hours.
Answer
Answer: (a) 7 hours and 21 hours
Hint:
7, 21 → 98°F
Question 18.
103°F temperature is at time
(a) 11 hours
(b) 13 hours
(c) 15 hours
(d) 21 hours.
Answer
Answer: (a) 11 hours
Hint:
103°F → 11 hours
Question 19.
What is the difference of temperatures at 7 hours and 21 hours ?
(a) 0°F
(b) 1°F
(c) 2°F
(d) 3°F.
Answer
Answer: (a) 0°F
Hint:
98-98 = 0
Question 20.
What is the rise in temperature from 11 hours to 13 hours ?
(a) 1°F
(b) 2°F
(c) 4°F
(d) 3°F.
Answer
Answer: (a) 1°F
Hint:
104 – 103 = 1
Question 21.
What is the fall in temperature from 13 hours to 21 hours ?
(a) 2°F
(b) 3°F
(c) 4°F
(d) 6°F
Answer
Answer: (d) 6°F
Hint:
104 – 98 = 6
Question 22.
The coordinates of the origin are
(a ) (0, 0)
(b) (1, 0)
(c) (0, 1)
(d) (1, 1).
Answer
Answer: (a ) (0, 0)
Hint:
0 → (0, 0)
Question 23.
What are the coordinates of a point whose x-coordinate is 3 and y-coordinate is 4?
(a) (3, 3)
(b) (3, 4)
(c) (4, 3)
(d) (4, 3).
Answer
Answer: (b) (3, 4)
Question 24.
What are the coordinates of a point whose x-coordinate is 1 and y-coordinate isO?
(a) (1, 0)
(b) (0, 0)
(c) (0, 1)
(d) (1, 1).
Answer
Answer: (a) (1, 0)
Question 25.
What are the coordinates of a point whose x-coordinate is 0 and y-coordinate is 1?
(a) (0, 1)
(b) (0, 0)
(c) (1, o)
(d) (1, 1).
Answer
Answer: (a) (0, 1)
Observe the following velocity-time graph and answer the related questions:
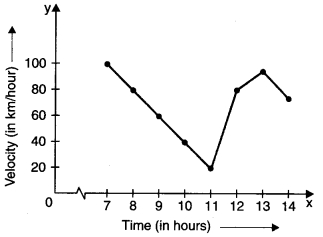
Question 26.
At what time is the velocity maximum ?
(a) 7
(b) 8
(c) 9
(d) 10.
Answer
Answer: (a) 7
Hint:
7 → 100
Question 27.
At what time is the velocity minimum ?
(a) 8
(b) 9
(c) 10
(d) 11.
Answer
Answer: (d) 11
Hint:
11 → 20
Question 28.
At what times are the velocities equal ?
(a) 8 and 12
(b) 9 and 11
(c) 7 and 12
(d) 11 and 13.
Answer
Answer: (a) 8 and 12
Hint:
8 → 80
12 → 80
Question 29.
What is the fall in velocity from 7 to 11 ?
(a) 80 km/hour
(b) 90 km/hour
(c) 100 km/hour
(d) 20 km/hour.
Answer
Answer: (a) 80 km/hour
Hint:
100 – 20 = 80
Question 30.
What is the rise in velocity from 11 to 12?
(a) 10 km/hour
(b) 20 km/hour
(c) 30 km/hour
(d) 60 km/hour.
Answer
Answer: (d) 60 km/hour
Hint:
80 – 20 = 60
Observe the following runs-over graph and answer the related questions:
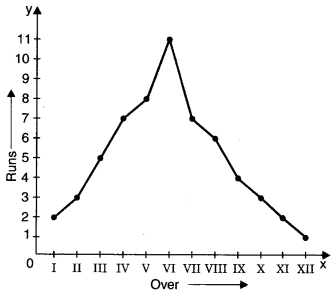
Question 31.
In which over are the maximum runs scored ?
(a) II
(b) IV
(c) V
(d) VI.
Answer
Answer: (d) VI
Hint:
VI → 11
Question 32.
In which over are the minimum runs scored ?
(a) X
(b) XI
(c) XII
(d) IX.
Answer
Answer: (c) XII
Hint:
XII → 1
Question 33.
What is the difference of runs scored in IV and V overs ?
(a) 1
(b) 2
(c) 3
(d) 4.
Answer
Answer: (a) 1
Hint:
8 – 7 = 1
Question 34.
What is the sum of runs scored in I and XII overs ?
(a) 1
(b) 2
(c) 3
(d) 4.
Answer
Answer: (c) 3
Hint:
2 + 1 = 3
Question 35.
3 runs are scored in which overs ?
(a) II and X
(b) I and V
(c) VII and VIII
(d) X and XII
Answer
Answer: (a) II and X
Hint:
II → 3, X → 3
Read the graph and answer the related questions:
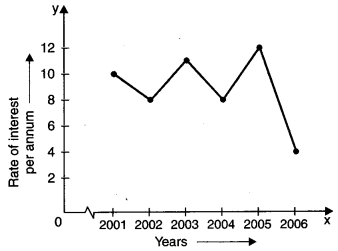
Question 36.
In which year was the rate of interest maximum ?
(a) 2005
(b) 2003
(c) 2006
(d) 2002.
Answer
Answer: (a) 2005
Hint:
2005 → 12
Question 37.
In which year was the rate of interest minimum ?
(a) 2006
(b) 2004
(c) 2001
(d) 2005.
Answer
Answer: (a) 2006
Hint:
2006 → 4
Question 38.
The difference in the maximum and minimum rates of interest was
(a) 2%
(b) 4%
(c) 6%
(d) 8%.
Answer
Answer: (d) 8%
Hint:
12 – 4 = 8
Question 39.
Rise in interest from 2004 to 2005 was
(a) 2%
(b) 4%
(c) 6%
(d) 8%.
Answer
Answer: (b) 4%
Hint:
12 – 8 = 4
Question 40.
The fall in interest from 2001 to 2002 was
(a) 1%
(b) 2%
(c) 3%
(d) 4%.
Answer
Answer: (b) 2%
Hint:
10 – 8 = 2
Read the graph and answer the related questions:
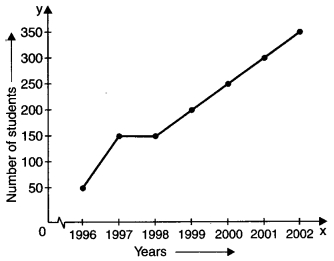
Question 41.
How many students appeared in the year 2000 ?
(a) 200
(b) 250
(c) 300
(d) 350.
Answer
Answer: (b) 250
Hint:
2000 → 250
Question 42.
In which year did 50 students appear ?
(a) 1998
(b) 2001
(c) 1997
(d) 1996.
Answer
Answer: (d) 1996
Hint:
50 → 1996
Question 43.
In which year did the maximum number of students appear ?
(a) 2002
(b) 2000
(c) 2001
(d) 1999.
Answer
Answer: (a) 2002
Hint:
2002 → 350
Question 44.
What is the maximum number of students that appeared in any year ?
(a) 350
(b) 300
(c) 250
(d) 300.
Answer
Answer: (a) 350
Hint:
350
Question 45.
In which two years was the number of students appearing was the same ?
(a) 1997 and 1998
(b) 1998 and 1999
(c) 1999 and 2000
(d) 2000 and 2001.
Answer
Answer: (a) 1997 and 1998
Hint:
1997 → 150
1998 → 150
Read the graph and answer the related questions:
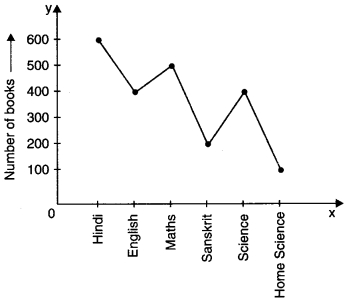
Question 46.
The maximum books are of which subject ?
(a) Hindi
(b) Science
(c) English
(d) Sanskrit.
Answer
Answer: (a) Hindi
Hint:
Hindi → 600
Question 47.
The minimum books are of which subject ?
(a) Home Science
(b) Sanskrit
(c) Science
(d) English
Answer
Answer: (a) Home Science
Hint:
Home Science → 100
Question 48.
500 books are of which subject ?
(a) English
(b) Science
(c) Hindi
(d) Maths.
Answer
Answer: (d) Maths
Hint:
500 → Maths
Question 49.
How many books are of subject Home Science ?
(a) 100
(b) 200
(c) 300
(d) 400.
Answer
Answer: (a) 100
Hint:
Home Science → 100
Question 50.
How many books are there in Sanskrit and Home Science taken together ?
(a) 100
(b) 200
(c) 300
(d) 400.
Answer
Answer: (c) 300
Hint:
Sanskrit → 200
Home Science → 100
200 + 100 = 300
Read the graph and answer the related questions:
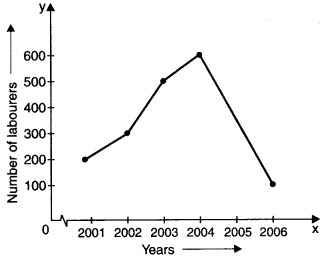
Question 51.
In which year was the number of labourers maximum ?
(a) 2001
(b) 2002
(c) 2003
(d) 2004.
Answer
Answer: (d) 2004
Hint:
2004 → 500
Question 52.
In which year was the number of labourers minimum ?
(a) 2003
(b) 2004
(c) 2005
(d) 2006.
Answer
Answer: (d) 2006
Hint:
2006 → 100
Question 53.
What was the difference of the number of labourers in the years 2002 and 2003 ?
(a) 100
(b) 200
(c) 300
(d) 400.
Answer
Answer: (b) 200
Hint:
2002 → 300
2003 → 500
500 – 300 = 200
Question 54.
Find the rise in the number of labourers from 2001 to 2004.
(a) 200
(b) 300
(c) 400
(d) 500.
Answer
Answer: (c) 400
Hint:
2001 → 200
2004 → 600
600 – 200 = 400
Question 55.
Find the sum of the number of labourers in the years 2004 and 2006.
(a) 700
(b) 600
(c) 200
(d) 500.
Answer
Answer: (a) 700
Hint:
2004 → 600
2006 → 100
600 + 100 = 700
Read the circle graph and answer the related questions:
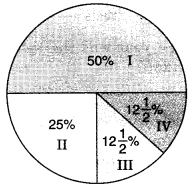
Question 56.
There are in all 1000 students in a school. The number of students of class I are
(a) 500
(b) 250
(c) 125
(d) none of these.
Answer
Answer: (a) 500
Hint:
\(\frac{50}{100}\) × 1000 = 500
Question 57.
The number of students of class II is
(a) 500
(b) 250
(c) 125
(d) 100.
Answer
Answer: (b) 250
Hint:
\(\frac{25}{100}\) x 1000 = 250
Question 58.
In which two classes is the number of students the same ?
(a) I and II
(b) I and III
(c) III and IV
(d) I and IV.
Answer
Answer: (c) III and IV
Hint:
III → 12\(\frac{1}{2}\)%
IV → 12\(\frac{1}{2}\)%
Question 59.
The minimum number of students in any class is
(a) 125
(b) 250
(c) 500
(d) 1000.
Answer
Answer: (a) 125
Hint:
\(\frac{25}{2}\) × \(\frac{1000}{100}\) = 125
Question 60.
The sum of the number of students of class III and class IV is
(a) 500
(b) 1000
(c) 50
(d) 250.
Answer
Answer: (d) 250
Hint:
125 + 125 = 250
Question 61.
A ________ is a bar graph that shows data in intervals.
(a) Bar-graph
(b) Pie-chart
(c) Histograph
(d) Line Graph
Answer
Answer: (c) Histograph
Question 62.
A graph that displays data that changes continuously over periods of time is called:
(a) Bar-graph
(b) Pie-chart
(c) Histograph
(d) Line Graph
Answer
Answer: (d) Line Graph
Question 63.
A line graph which is a whole unbroken line is called a:
(a) Linear graph
(b) Pie-chart
(c) Histograph
(d) Bar-graph
Answer
Answer: (a) Linear graph
Question 64.
Which point lies of y-axis?
(a) (-2, 0)
(b) (2, 0)
(c) (0, -2)
(d) (2, -2)
Answer
Answer: (c) (0, -2)
Question 65.
If we join (-3,2), (-3,-3) and (-3,4), then we obtain:
(a) A triangle
(b) Straight-line without passing through origin
(c) Straight-line passing through origin
(d) None of the above
Answer
Answer: (b) Straight-line without passing through origin
Question 66.
The point (4, 0) lies on which of the following?
(a) x-axis
(b) y-axis
(c) origin
(d) None of the above
Answer
Answer: (a) x-axis
Question 67.
The point (-2,-2) is:
(a) near to x-axis
(b) near to y-axis
(c) near to origin
(d) Equidistant from x-axis and y-axis.
Answer
Answer: (d) Equidistant from x-axis and y-axis.
Question 68.
The point (-2, 5) is nearer to:
(a) x-axis
(b) y-axis
(c) origin
(d) None of the above
Answer
Answer: (a) x-axis
Question 69.
The point (-5, 2) is nearer to:
(a) x-axis
(b) y-axis
(c) origin
(d) None of the above
Answer
Answer: (b) y-axis
Question 70.
The point (0, 0) lies at:
(a) x-axis
(b) y-axis
(c) origin
(d) None of the above
Answer
Answer: (c) origin
We hope the given NCERT MCQ Questions for Class 8 Maths Chapter 15 Introduction to graphs with Answers Pdf free download will help you. If you have any queries regarding Introduction to graphs CBSE Class 8 Maths MCQs Multiple Choice Questions with Answers, drop a comment below and we will get back to you soon.
Class 8 Maths MCQ:
- Rational Numbers Class 8 MCQ
- Linear Equations in One Variable Class 8 MCQ
- Understanding Quadrilaterals Class 8 MCQ
- Practical Geometry Class 8 MCQ
- Data Handling Class 8 MCQ
- Squares and Square Roots Class 8 MCQ
- Cubes and Cube Roots Class 8 MCQ
- Comparing Quantities Class 8 MCQ
- Algebraic Expressions and Identities Class 8 MCQ
- Visualising Solid Shapes Class 8 MCQ
- Mensuration Class 8 MCQ
- Exponents and Powers Class 8 MCQ
- Direct and Indirect Proportions Class 8 MCQ
- Factorisation Class 8 MCQ
- Introduction to Graphs Class 8 MCQ