Students can access the CBSE Sample Papers for Class 11 Economics with Solutions and marking scheme Set 4 will help students in understanding the difficulty level of the exam.
CBSE Sample Papers for Class 11 Economics Set 4 with Solutions
Time : 3 Hours
Maximum Marks : 80
General Instructions:
- 1. This question paper contains two sections:
Section A – Statistics for Economics Section B – Introductory Micro Economics - This paper contains 20 Multiple Choice Questions type questions of 1 mark each.
- This paper contains 4 Short Answer Questions type questions of 3 marks each to be answered in 60 to 80 words.
- This paper contains 6 Short Answer Questions type questions of 4 marks each to be answered in 80 to 100 words.
- This paper contains 4 Long Answer Questions type questions of 6 marks each to be answered in 100 to 150 words.
Section – A
Question 1.
Read the following Statements and choose the correct alternative: [1]
Statement – Is – The proper use of statistics can be made by specialists.
Statement – II:- Statistics is the study of qualitative facts.
Alternatives:
(A) Statement I is true and Statement II is false.
(B) Statement I is false and Statement II is true.
(C) Both Statements I and II are true.
(D) Both Statements I and II are false.
Answer:
Option (A) is correct
Explanation: Only the facts which can be expressed in terms of numbers can be studied in Statistics.
Question 2.
Which of the following statements is false regarding mode: [1]
(A) It is easy to calculate and can be easily understood. It can be located by inspection only.
(B) It is affected by the extreme values in a series.
(C) It can be calculated even in case of open-end classes.
(D) Mode helps in describing the qualitative aspects of phenomenon.
Answer:
Option (B) is correct
Explanation: Mode is not affected by the extreme values in a series.
Question 3.
Statistics implies: [1]
(A) Data
(B) Statistical methods
(C) Both (A) and (B)
(D) Neither (A) nor (B)
Answer:
Option (C) is correct
Explanation: Statistics has data and also uses some statistical tools and methods to analyse them.
Question 4.
Identify the correct pair of terms and definitions from the following Columns I and II: [1]
| Column I | Column II |
| A. Middle item | 1. Mean |
| B. Highest Frequency | 2. Mode |
| C. Effected by extreme items | 3. Median |
| D. Calculated by grouping | 4. Combined Mean |
(A) A – 1
(B) B – 2
(C) C – 3
(D) D – 4
Answer:
Option (B) is correct
Explanation: Mode is the item having highest frequency.
Question 5.
Less than ogive curve is given below. What is presented by the ogive curve in given diagram? [1]
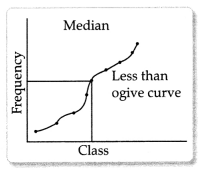
(A) Frequency
(B) Cumulative frequency
(C) Size of Class
(D) All of these
Answer:
Option (B) is correct
Explanation: The ogive curve representing cumulative frequency while estimating median value.
Question 6.
The data collected by the investigator is called: [1]
(A) Primary data
(B) Secondary data
(C) Both (A) and (B)
(D) Neither (A) nor (B)
Answer:
Option (A) is correct
Explanation: Primary data are those data which are collected for the first time. They are original in character.
Question 7.
When selected units of the universe are studied, then it is called: [1]
(A) Practical Investigation
(B) Sample Investigation
(C) Census Investigation
(D) None of the these
Answer:
Option (B) is correct
Explanation: As the investigation is being done of the data collected from a particular sample, it is called Sample Investigation.
Question 8.
Which of the following statements is true about the significance of Economics: [1]
I. Economics helps in the study of the laws of motion.
II. Economics helps in the study of man and environment.
III. Economics helps in solving the problem of distribution.
IV. Economics helps in saving the mankind.
Alternatives:-
(A) Only -1
(B) Only – II
(C) Only – III
(D) Only – IV
Answer:
Option (C) is correct
Explanation: Economics helps in solving the central problem of an economy regarding distribution of resources.
Question 9.
Read the following Assertion (A) and Reason (R) and choose the correct alternative: [1]
Assertion (A): A good questionnaire helps in the collection of primary data.
Reason (R): Primary Data is the first hand data collection.
Alternatives:
(A) Both Assertion (A) and Reason (R) are true, and Reason (R) is the correct explanation of Assertion (A).
(B) Both Assertion (A) and Reason (R) are true, but Reason (R) is not the correct explanation of Assertion (A).
(C) Assertion (A) is true, but Reason (R) is false.
(D) Assertion (A) is false, but Reason (R) is true.
Answer:
Option (B) is correct
Question 10.
As far as possible, construction of continuous frequency distribution should be based on following class interval:
[1]
(A) Equal class interval
(B) Unequal class interval
(C) Open end class interval
(D) None of the these
Answer:
Option (A) is correct.
Explanation: An equal class interval is the basis for the continuous frequency distribution as it helps in the proper evaluation of the data.
Question 11.
‘”Statistics is defined as aggregate of numerical facts’.” [3]
Do you agree with the given statement? Give any example in support of your answer.
Answer:
Yes, I agree. ‘Statistics is defined as aggregate of numerical facts’. This implies that for figures to be included in statistics, they must be aggregate of facts and not individual figures.
For example: The fact that height of a student is five feet tells nothing unless it is comparable. Another example, suppose we collect data of 1000 school¬going children. But these data will not be useful unless organized into groups, tables, etc.
Question 12.
Mr. Ashok was getting ₹400 in the base year and ₹800 in the current year. If Consumer Price Index is 350, then what extra amount is required for maintaining the earlier standard of living? [3]
OR
Mode is the best representative value of all items of a series because it is that value which occurs most frequently in the series. State any three advantages of Mode in the context of above statement.
Answer:
For former standard of living, Ashok should get
\(\frac{₹ 400 \times ₹ 350}{100}\) = ₹1,400
Amount required for maintaining the same standard of living
= ₹1400 – ₹1800 = ₹600
OR
Mode is the best representative value of all items of a series because:
(i) It is easy to calculate and can be easily understood. It can be located by inspection only.
(ii) It is not affected by the extreme values in a series.
(iii) It can be calculated even in case of open-end classes.
Question 13.
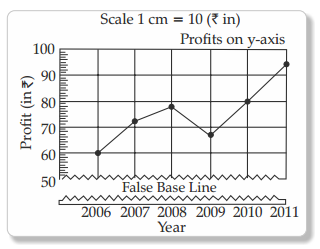
Show the annual profit figures of a firm with the help of a time series graph: [4]
| Year | Profit (₹ in ‘000) |
| 2006 | 60 |
| 2007 | 72 |
| 2008 | 75 |
| 2009 | 65 |
| 2010 | 80 |
| 2011 | 95 |
Answer:
As per the question years, 2006 to 2011 and their respective profits are given. Before plotting the graph a false base line should be prepared in order to make profit scale equal.
A time series graph of given annual profit figures is shown below:-
Question 14.
Calculate the median from the following data: [4]
| Marks | Number of students |
| More than 0 | 50 |
| More than 10 | 42 |
| More than 20 | 38 |
| More than 30 | 28 |
| More than 40 | 16 |
| More than 50 | 3 |
OR
Calculate Mode from the following data: [4]
| Marks | No. of students |
| o – 10 | 5 |
| 10 – 20 | 12 |
| 20 – 30 | 14 |
| 30 – 40 | 10 |
| 40 – 50 | 8 |
| 50 – 60 | 6 |
Answer:
Given data is cumulative frequencies distribution, so firstly we convert them into simple frequencies.
Calculation of Median
| Marks | Number of Students (f) | Cumulative Frequency (c.f) |
| 0 – 10 | 8 | 8 |
| 10 – 20 | 4 | 12 |
| 20 – 30 | 10 | 22 |
| 30 – 40 | 12 | 34 |
| 40 – 50 | 13 | 47 |
| 50 – 60 | 3 | 50 |
Median = Size of \(\left(\frac{\mathrm{N}}{2}\right)[latex] th item.
= Size of [latex]\left(\frac{50}{2}\right)[latex] th item.
= Size of 25th item.
This lies in 30 – 40 groups.
By Interpolation:
Median Value = L1 + [latex]\frac{\frac{N}{2}-C F}{f}[latex] × i
= 30 + [latex]\frac{25-22}{12}[latex] × 10
= 30 + [latex]\frac{3}{12}[latex] × 10
= 30 + 25
= 32.5
OR
| Marks | No. of students |
| 0-10 | 5 |
| 10 – 20 | 12 |
| 20 – 30 | 14 |
| 30 – 40 | 10 |
| 40 – 50 | 8 |
| 50 – 60 | 6 |
Mode lies in 20 – 30 groups
Mode =L1 + [latex]\frac{f_1-f_0}{2 f_1-f_0-f_2}\) × i
= 20 + \(\frac{14-12}{2 \times 14-12-10}\) × 10
= 20 + \(\frac{2}{28-22}\) × 10
= 20 + 3.3
= 23.3
Question 15.
Find out the missing item x of the following, where Arithmetic Mean is 11.37. [4]
| X | Frequency (f) |
| 5 | 2 |
| 7 | 4 |
| X | 29 |
| 11 | 54 |
| 13 | 11 |
| 16 | 8 |
| 20 | 4 |
Answer:
| X | Frequency (f) | fx |
| 5 | 2 | 10 |
| 7 | 4 | 28 |
| x | 29 | 29x |
| 11 | 54 | 594 |
| 13 | 11 | 143 |
| 16 | 8 | 128 |
| 20 | 4 | 80 |
| Σf = 112 | ΣfX = 983 + 29x |
Mean Value = \(\frac{\sum f x}{\sum f}\)
Mean value is given as 11.37
Thus,
11.37= \(\frac{983+29 x}{112}\)
11.37 × 112 = 983 + 29x
1273.44 – 983 = 29x
X = \(\frac{290.44}{29}=\) = 10.01
Missing frequency is 10.01
Question 16.
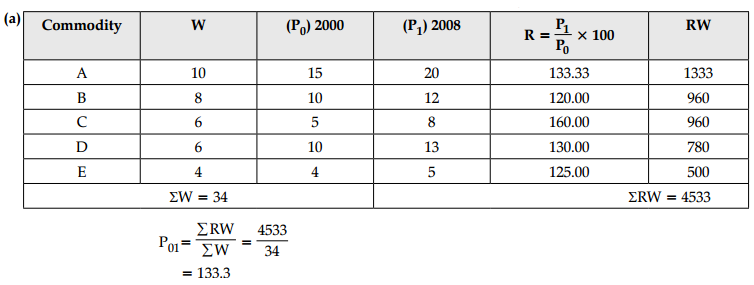
(a) Calculate the Weighted Average of price relative index for 2008 on the basis of 2000 from the following data: [3]
| Commodity | W | 2000 (p0) | 2008 (p1) |
| A | 10 | 15 | 20 |
| B | 8 | 10 | 12 |
| C | 6 | 5 | 8 |
| D | 6 | 10 | 13 |
| E | 4 | 4 | 5 |
(b) Discuss the different methods of classification of data. [3]
OR
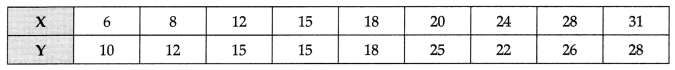
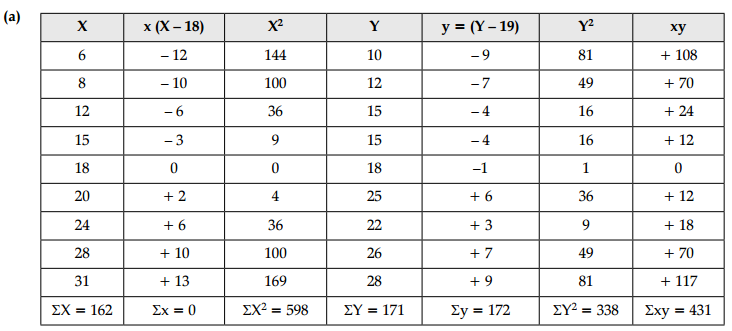
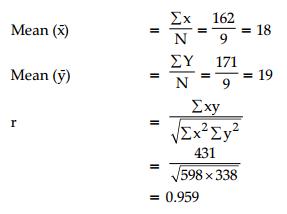
(a) Calculate Karl Pearson’s co-efficient of correlation with the help of following data:
(b) What are the general guidelines for the construction of a frequency distribution?
Answer:
(b) The various methods of classification of Data are as follows:
- Geographical Classification: When the data is classified according to certain geographical locations, then such a classification is called Geographical Classification.
- Chronological Classification: When the data are classified with respect to different periods of times then it is called Chronological Classification.
- Conditional Classification: When data are classified with respect to condition, the type of classification is called Conditional Classification.
- Qualitative Classification: In Qualitative classification, data are classified on the basis of some qualitative phenomenon. For example: when classification is done on the basis of two attributes as, sex (male and female), etc.
- Quantitative classification: When a statistical enquiry is conducted and one of the variables is recorded
one after the other then a group of numbers is formed. (Any three)
OR
(b) The main general guidelines for the construction of a frequency distribution are:
- All class intervals should be of equal size.
- The lower limit of the first class should either be 0.5 or multiple of 5.
- We should avoid odd sized class interval.
- Open-end classes should be avoided.
Question 17.
(a) Define Statistics and discuss its limitations? [3]
(b) Distinguish between Exclusive method and Inclusive method.
Answer:
The word statistics is used both in plural as well as in singular sense. In plural sense, statistics means numeric facts which can be used to draw conclusions and in singular sense, it means the statistical methods with the help of which statistical information is used to treat and draw conclusions from them.
There are following limitations of statistics:
Sometimes, when data are not properly collected then there is likelihood to draw wrong conclusions. Therefore, it is necessary to know the limitations of statistics.
- Statistics does not study about individuals: Statistics are expressed in facts. It does not study individuals. For example, there are five students in a class. Statistics only tells the average marks obtained in class, not how many marks are obtained by every student in the class.
- It does not study the qualitative aspect of problem: The most important condition of statistical study is that subject of investigation and inquiry should be capable of being quantitatively measured. It does not study the qualitative aspect of a problem. For example, honesty, poverty, etc.
- Statistics can be misused: The result obtained can be manipulated according to one’s own interest and such manipulated results can mislead the community.
- Statistical results lack mathematical accuracy: The results drawn from statistical analysis are normally in approximates. As the statistical analysis is based on observation of mass data, number of inaccuracies may be present and it is difficult to rectify them.
- Uniformity and homogeneity of data: It is essential that data must have the quality of uniformity and homogeneity. Heterogeneous data are not comparable. For example, it would be meaningless to compare the heights of men with heights of trees because these figures are of heterogeneous character. (Any two)
(b) Exclusive method: In this method, series are so formed that the upper limit of one class interval is the lower limit of the next class interval. Here the upper limit of one class interval is equal to the lower limit of its next class interval. Inclusive Method: In this method, series are so formed that lower limit and the upper limit of a class interval are included in the class itself. Here the upper limit of one class interval is not equal to the lower limit of its next class interval
Section – B
Question 18.
Identify the correct pair of items from the following Columns I and II [1]
| Column I | Column II |
| A. Black marketing | 1. A consequence of price ceiling |
| B. Price ceiling | 2. It is the lowest legal price |
| C. MSP | 3. Price ceiling tools |
| D. Subsidiary | 4. Determine by the market forces |
Alternatives:
(A) A -1
(B) B – 2
(C) C – 3
(D) D – 4
Answer:
Option (A) is correct.
Explanation: – Black marketing may be termed as a direct consequence of price ceiling, as it implies a situation whereby the commodity, under the government’s control policy, is illegally sold at a higher price than the one fixed by the government.
Question 19.
According to the Law of Diminishing Marginal Utility, when MU is negative TU is…. [1]
(A) Starts rising
(B) Starts falling
(C) Minimum
(D) Maximum
Answer:
Option (B) is correct.
Explanation: – According to the law of diminishing marginal utility, when MU becomes negative then TU starts falling.
Question 20.
Which of the following statement is true: [1]
(A) Marginal Product refers to total output produced by a firm during a given period of time with given number of inputs.
(B) Average Product refers to total output produced by a firm during a given period of time with given number of inputs.
(C) Total Product refers to total output produced by a firm during a given period of time with given number of inputs.
(D) Total Product refers to total input produced by a firm during a given period of time with given number of outputs.
Answer:
Option (C) is correct.
Explanation: – Option A is false as Marginal Product is the output produced with one extra unit of input. Option (B) is false as Average product is the output produced per unit of input. Option (D) is false because Total Product is the total output produced by the firm during the given period of time with the given number of inputs.
Question 21.
Study the following diagram. The given diagram is associated with which form of market? [1]
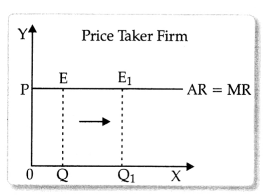
(A) Monopoly
(B) Perfect competition
(C) Monopolistic
(D) None of these
Answer:
Option (B) is correct.
Explanation: – The given curve is associated with perfect competition market. In perfect competition market, seller becomes price taker instead of price maker. Price of goods is determined by the free play of market forces.
Question 22.
Read the statements Assertion (A) and Reason (R) and choose the correct alternative: [1]
Assertion (A): A firm is able to sell more quantity of a good only by lowering the price.
Reason (R): The firm’s Marginal Revenue, as he goes on selling, would be less than Average Revenue. Alternatives:
(A) Both Assertion (A) and Reason (R) are correct, and Reason (R) is the correct explanation of Assertion (A).
(B) Both Assertion (A) and Reason (R) are correct, but Reason (R) is not the correct explanation of Assertion (A).
(C) Assertion (A) is true but Reason (R) is false.
(D) Assertion (A) is false but Reason (R) is true.
Answer:
Option (B) is correct.
Explanation: – A firm is able to sell more quantity of a good only by lowering the prices as the good will become more competitive and so the sales will increase.
Question 23.
If a firm produces zero output in the short period, then: [1]
(A) TC will be zero
(B) VC will be positive
(C) FC will be positive
(D) MC will be zero
Answer:
Option (C) is correct.
Explanation: – When the firm produces zero output, it will still incur fixed cost but no variable cost will be incurred by it. Thus, the Total Cost cannot be zero as it includes the Fixed Cost. Variable Cost cannot be positive as it will be zero and neither MC will be zero, so only FC will be positive.
Question 24.
“Profit is maximised when MC = MR” [1]
Which of the following assumption is associated with above phenomenon: [1]
(A) MC cuts the MR curve from below
(B) MC cuts the MR curve from above
(C) TC cuts the TR curve from above
(D) MC cuts the MR curve from below
Answer:
Option (A) is correct.
Explanation: – Profit is maximised not only when MC = MR but also when the MC cuts the MR curve from below.
Question 25.
Which one of the following is not a determinant of individual supply: [1]
(A) Price of the given commodity
(B) Taxation policy
(C) State of technology
(D) Number of firms
Answer:
Option (D) is correct.
Explanation: – Number of firms in the market will affect the market supply and not the supply of an individual firm.
Question 26.
There are two statements given below, marked as Statement (I) and Statement (II). Read the statements and choose the correct option: [1]
Statement – I: Monotonic preferences means the consumer preferences regarding greater consumption of goods and services.
Statement – II: Greater consumption of a commodity always offers him a higher level of satisfaction. Alternatives
(A) Statement I is true and Statement II is false
(B) Statement I is false and Statement II is true
(C) Both statements I and II are true
(D) Both statements I and II are false
Answer:
Option (C) is correct.
Explanation: – Consumer’s preferences are called monotonic when between any two bundles, consumer always choose a bundle having more of one good and no less of other good. It means the consumer preferences are such that greater consumption of a commodity always offers him a higher level of satisfaction.
Question 27.
If AR curve is a horizontal straight line, the MR curve will be… [1]
(A) Downward sloping
(B) Horizontal straight line
(C) Upward sloping
(D) Inversely shaped
Answer:
Option (B) is correct.
Explanation: – Both the AR and the MR curve have the same shape.
Question 28.
What difference does it make to the market when we say that there are large number of sellers in a perfectly competitive market? Explain. [3]
OR
What conditions must hold if a profit-maximizing firm produces positive output in a competitive market?
Answer:
The number of sellers is so large that no individual firm can influence the market price on its own. The proportion of output produced by an individual firm is insignificant. Therefore, an individual firm, whether raises output or reduces output, it has no effect on market price of the goods.
OR
The following three conditions must hold if a profit- maximising firm produces positive level of output (say equilibrium output Q) in a competitive market:
- MR must be equal to MC at Q.
- MC should be upward sloping or rising at Q.
- In short-run – Price must be greater than or equal to AVC.
- In long-run – Price must be greater than or equal to LAC.
Question 29.
“Indian Government use ‘Buffer stock’ as a tool of price floor.” [3]
Justify the above statement with valid arguments.
Answer:
Buffer stock is an important tool in the hands of government to ensure price floor/minimum support price. If in case, the market price is lower than what the government feels should be given to the farmers/ producers it would purchase the commodity at higher price from the farmers/producers so as to maintain stock of the commodity with itself to be released in case of shortage of the commodity in future.
Question 30.
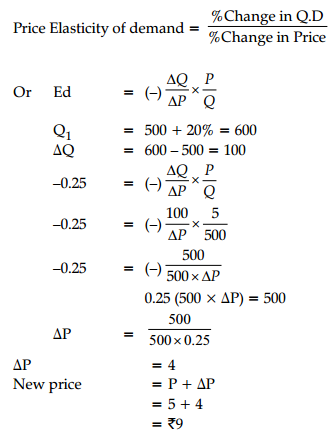
The price elasticity of demand for a commodity is (-0.25). The demand of the commodity is 500 units at the unit price of ₹5. What will be the price if the demand for the commodity increases by 20% ? [4]
Answer:
Question 31.
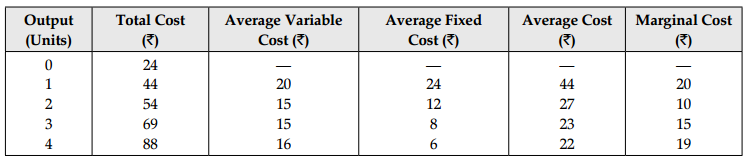
Complete the following table: [4]
| Output (Units) | Total Cost (₹) | Average Variable Cost (₹) | Marginal Cost (₹) |
| 0 | 24 | ………….. | ………… |
| 1 | 44 | …………. | ………… |
| 2 | ……………. | 15 | …………. |
| 3 | ……………. | …………. | 15 |
| 4 | 88 | …………. | …………… |
OR
Explain any four factors causing a shift of supply curve of a commodity.
Answer:
OR
Change in supply means the shift of supply curve. With increase in supply, supply curve shifts to the right and with decrease in supply, the supply curve shifts to the left. The following factors cause a change in supply:
- Technological Changes: When there is technological improvement, output is produced at lower cost. Lower cost of production increases the supply of the commodity. The supply curve shifts to the right.
- Price of Other Goods: When price of substitute good increases, the quantity supplied of the concerned good decreases and there is a backward shift of the supply curve. Supply curve shifts forward in case price of the substitute good decreases.
- Price of Factors of Production: If factor price decreases, cost of production also decreases. Accordingly, supply increases and the supply curve shifts to the right. If factor price increases, supply tends to decline and there is a backward shift in supply curve.
- Number of Firms: Increase in the number of firms implies increase in market supply and conversely, decrease in number of firms reduces the market supply of the commodity.
Question 32.
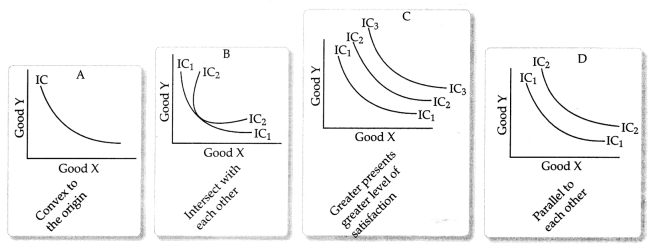
There are four diagrams of IC curve given below. Each diagram presenting one property of indifference curve. Identify the wrong properties of indifference curve? Discuss the properties of IC curve. [4]
Answer:
The given curves shows the properties of indifference curve. Only diagram B is a wrong feature of IC. Let’s discuss briefly about the properties of indifference curve.
Diagram A : Indifference Curves are convex to the point of origin: An Indifference Curve will ordinarily be convex to the origin. This is because of Diminishing Marginal Rate of Substitution.
Diagram B : Indifference Curves never touch or intersect each other: Each Indifference Curve represents a different level of satisfaction. So, their intersection is ruled out.
Diagram C : Higher Indifference Curve represents higher level of satisfaction: A higher indifference curve represents those combinations which yield higher level of satisfaction than combinations on the lower indifference curves.
Diagram D : Indifference Curve major may not be parallel to each other: This is because the rate of diminishing marginal substitution of two goods is not necessarily equal to the other indifference curves.
Question 33.
(a) Explain the condition of producer’s equilibrium with the help of a numerical example. Use Marginal Cost and
Marginal Revenue approach. [3]
(b) What does the average fixed cost curve look like ? Why does it look so? [3]
OR
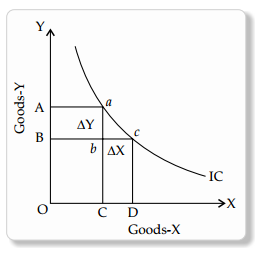
(a) Explain the concept of Marginal Rate of Substitution with the help of numerical example. Also explain its
behaviour along an indifference curve.
(b) Can there be some fixed cost in the long-run? If not. Why?
Answer:
| Output | MR (₹) | MC (₹) |
| 1 | 10 | 12 |
| 2 | 10 | 10 |
| 3 | 10 | 9 |
| 4 | 10 | 10 |
| 5 | 10 | 13 |
Producer’s equilibrium refers to a situation, where a producer is producing that Level of output at which its profits are maximum. In other words, it is a situation of profit maximisation.
Following are the two conditions of producer’s equilibrium:
(i) MR = MC
(ii) MC must be rising at the point of equilibrium or MC curve must cut MR curve from below:
These conditions are satisfied when 4 units of output are produced in the given schedule.
(b) The average fixed cost (AFC) curve looks like a Rectangular Hyperbola. It happens because same amount of fixed cost is divided by increasing output. As a result, AFC curve slope downwards and is rectangular hyperbola, i.e., area under AFC curve remains same at different points.
OR
Marginal Rate of Substitution (MRS) means the rate at which a consumer is willing to sacrifice quantity of one good to obtain one more unit of the other good. Let the two goods consumed be A and B. Suppose the following combinations of these two goods have the same utility level for him:
| Good A | Good B | MRS |
| 1 | 8 | — |
| 2 | 4 | 4B: 1A |
| 3 | 1 | 3B: 1A |
The consumer is willing to sacrifice 4B to obtain second unit of A. For the third unit of A, he is willing to sacrifice less because marginal utility of A decreases as he consumes more of A.
(b) No, there cannot he any fixed cost in the long run. In the long run, a firm has enough time to modify factor ratio and can change the scale of production. There is no fixed factor as the firm can change quantity of all the factors of production and therefore, there cannot be any fixed cost in the long-run.
Question 34.
Read the passage given below and answer the questions that are followed.
The production function of a firm is a relationship between inputs used and output produced by the firm. For various quantities of inputs used, it gives the maximum quantity of output that can be produced. We assume that the farmer uses only two inputs to produce wheat: land and labour. A production function tells us the maximum amount of wheat he can produce for a given amount of land that he uses, and a given number of hours of labour that he performs. Suppose that he uses 2 hours of labour/ day and 1 hectare of land to produce a maximum of 2 tonnes of wheat. Then, a function that describes this relation is called a production function. One possible example of the form this could take is:
q = K × L,
Where, q is the amount of wheat produced, K is the area of land in hectares, L is the number of hours of work done in a day.
On the basis of the given text and common understanding, answer the following questions:
(a) What is the total product of an input?. [2]
(b) What causes increasing returns to a factor? [2]
(c) What is the Law of Variable Proportions? [2]
Answer:
(a) It is the sum total of output produced by all units of labour (along with other factors of production). Thus, TP = AP × L
Sum of marginal product corresponding to all the units of variable-factor used in production. Thus, TP = ZMP
(b) Increasing returns occur owing to following reasons :
- Greater application of variable factor ensures fully utilisation of the fixed factor.
- Greater application of variable factor facilitates better division of labour.
- Greater application of variable factor improves co-ordination between the factors.
(c) Law of Variable Proportions states that when total of output or production of a commodity is increased by adding units of a variable input, while the quantities of other inputs are held constant, then MP of the variable factor initially rises and then falls after reaching a certain level of employment of the variable factor.