Students can access the CBSE Sample Papers for Class 11 Economics with Solutions and marking scheme Set 1 will help students in understanding the difficulty level of the exam.
CBSE Sample Papers for Class 11 Economics Set 1 with Solutions
Time : 3 Hours
Maximum Marks : 80
General Instructions:
- 1. This question paper contains two sections:
Section A – Statistics for Economics Section B – Introductory Micro Economics - This paper contains 20 Multiple Choice Questions type questions of 1 mark each.
- This paper contains 4 Short Answer Questions type questions of 3 marks each to be answered in 60 to 80 words.
- This paper contains 6 Short Answer Questions type questions of 4 marks each to be answered in 80 to 100 words.
- This paper contains 4 Long Answer Questions type questions of 6 marks each to be answered in 100 to 150 words.
Section – A
Question 1.
Read the following Statements and choose the correct alternative: [1]
Statement -I: Economics is a study of mankind in the ordinary business of life.
Statement – II: Alfred Marshall propounded the welfare-oriented definition of Economics.
Alternatives:
(A) Statement I is true and Statement II is false.
(B) Statement I is false and Statement II is true.
(C) Both Statements I and II are true.
(D) Both Statements I and II are false.
Answer:
Option (C) is correct
Explanation: Welfare-oriented definition of Economics was propounded by Alfred Marshall. According to Marshall, Economics is a study of mankind in the ordinary business of life. He believed that wealth is not an end in itself.
Question 2.
The published sources of data are: [1]
(A) Primary
(B) Secondary
(C) Both (A) & B
(D) Neither (A) nor (B)
Answer:
Option (B) is correct
Explanation: A published data is an example of secondary source of information because it is collected by someone for some other works
Question 3.
What type of correlation is present between the price and quantity demand of a commodity? [1]
(A) Positive
(B) Negative
(C) Natural
(D) Cannot be determined
Answer:
Option (B) is correct
Explanation: There is inverse relation between price and quantity demand of commodity. That s why it is negative correlation between price and quantity demand.
Question 4.
Identify the correct pair of terms with their definition from the following Columns I and II: [1]
| Column I | Column II |
| A. Census method | 1. It is a cheaper method |
| B. Sample method | 2. It is much expensive method |
| C. Lottery method | 3. Mechanical example of random sample |
| D. Survey method | 4. Secondary type data |
(A) A – 1
(B) B – 2
(C) C – 3
(D) D – 4
Answer:
Option (C) is correct
Explanation: Lottery method is a part of random sampling method which is one of the oldest ways and is a mechanical example of random sample.
Question 5.
Identify the following diagram and choose the correct alternative: [1]

(A) Pie-chart
(B) Frequency polygon
(C) Ogive
(D) Histogram
Answer:
Option (A) is correct
Explanation: The given diagram is a pie diagram to show percentage distribution of export to rest of the world.
Question 6.
We draw time series graph when ……………… is given about the variables. [1]
(A) Frequency
(B) Time Period
(C) Class Intervals
(D) Deviations
Answer:
Option (B) is correct
Explanation: When statistical series changes with respect to time than it is called time series, when it is plotted on graph paper it is time series graph or time diagram or simply algebraic line graph.
Question 7.
The essential condition for construction of histogram is: [1]
(A) Individual series
(B) Discrete series
(C) Continuous series
(D) None of the these
Answer:
Option (C) is correct
Explanation: Histograms are used with continuous data. They do not have gaps between bars.
Question 8.
Which of the following are characteristics of Scatter diagram following? Choose the correct alternatives. [1]
I. Relationship between two related variables.
II. Not affected by extreme values.
III. Average of percentage
IV. Helpful in fixation of salary and allowances
Altenatives:-
(A) I and II
(B) II and III
(C) I, II and III
(D) I, III and IV
Answer:
Option (A) is correct
Explanation: The most important feature of Scatter diagram is presentation of the relationship between two related variables and it is not affected by extreme values of the series.
Question 9.
If quantity supplied increases by 60% due to a 50% increase in price, then elasticity of supply is:
(A) (-) 1.2
(B) (+) 1.2
(C) (-) 0.83
(D) (+) 0.83
Answer:
Option (B) is correct.
Explanation: Es = (Percentage Change in the quantity supplied)/(Percentage change in the price) = 60% ÷ 50% = 1.2
Question 10.
Which of the following statements is true: [1]
(A) According to Fisher “Statistics is the science of average”.
(B) In the singular sense, statistics refers to quantitative data which are collected systematically.
(C) Statistics cannot deal with qualitative data.
(D) Statistics is an art only instead of science.
Answer:
Option (C) is correct.
Explanation: Yes, it is true that statistics cannot deal with qualitative data as they cannot be expressed in terms of numbers or cannot be quantified.
Question 11.
“Statistics affects everybody and touches life at many points”. [3]
Do you agree with the given statement? Give valid reason in support of your answer.
Answer:
Statistics is widely used in modern times. Initially, it was employed by the state to collect information in public affairs but it was not used in different spheres of human life. Now-a-days, statistics is used by workers, labour unions, traders, insurance companies, auditors, business men, politicians, etc. This is clear from following facts:
(i) Useful to politicians: The politicians and their supporters are immensely interested in knowing their prospects of winning election by sampling few voters prior to elections, the percentage of vote the candidate will receive in the election and results can be worked out.
(ii) Useful to economists: Statistics serves as a raw material to the economists in making certain economic laws.
(iii) Useful to finance minister: For making sound and balanced annual budget of the country, statistics plays a very important role. The minister too takes the help of accurate and reliable data regarding the state of affairs which is provided by statistics.
(iv) Useful to bankers: Statistics is very useful for bankers and banking industry. Every bank has a statistical department that helps to make its own policy.
Question 12.
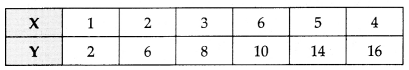
Calculate the correlation coefficient between X and Y and comment on their relationship. [3]
OR
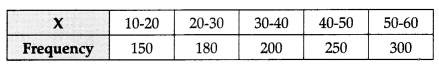
The following table gives the daily income of ten workers in a factory. Find the arithmetic mean.
Answer:
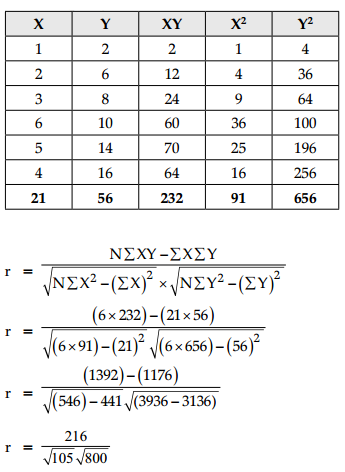
r = \(\frac{216}{10.25 \times 28.28}\)
r = \(\frac{216}{289.87}\)
r = 0.75
There is high degree of positive correlation.
OR
| Class | Frequency | Mid Value | FM |
| 10 – 20 | 150 | 15 | 2250 |
| 20 – 30 | 180 | 25 | 4500 |
| 30 – 40 | 200 | 35 | 7000 |
| 40 – 50 | 250 | 45 | 11250 |
| 50 – 60 | 300 | 55 | 16500 |
| ΣF = 1080 | ΣFM = 41500 |
Arithmetic Mean = \(\frac{\sum \mathrm{fm}}{\sum \mathrm{f}}\)
Arithmetic Mean = \(\frac{41,500}{1,080}\) = 38.42
Question 13.
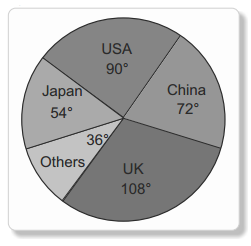
Distribution of export is shown in the following table. Prepare a pie diagram to show the percentage distribution of export: [4]
| Country | Export (in %) |
| USA | 25 |
| Japan | 15 |
| UK | 30 |
| China | 20 |
| Others | 10 |
Answer:
For constructing a pie diagram, it is necessary to convert the percentage into angles of different degree.
This conversion is shown below:
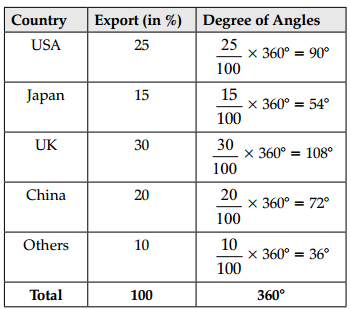
A pie diagram to show percentage distribution of export is given below:
Question 14.
(a) What are the advantages and disadvantages of collecting primary data by mailing questionnaire to respondent?
[4]
(b) Explain any two merits and any two demerits of sample method?
Answer:
Under this method, the investigator makes a questionnaire pertaining to the field of investigation. Blank spaces are left for writing answers. The questionnaire is sent to the respondent along with a covering letter, for soliciting their cooperation.
Merits:
- Wide Coverage: This method is used for extensive enquiries covering very wide area.
- Economy: This method is economical as it requires less time, money and labour.
Demerits:
- Limited Scope: This method is applicable only where respondents are educated.
- Less Accuracy and Precision: Under this method, the accuracy of data cannot be testified.
OR
(b) Sample method is that method in which some samples are collected from the total population.
Merits of Sample method :
- Cost of investigation is less.
- It has greater scope specially when size of the population is very large.
Demerits of sample method:
- Sometimes sample is not representative of the population. Hence it does not represent population.
- Also, specialised knowledge is required in framing a sample and drawing conclusions from it.
Question 15.
Which of the following methods give better results and why: [4]
(A) Census
(B) Sample
Answer:
Sample Method gives better results than the Census Method due to the following reasons:
(i) Accuracy: Although census method provides more accurate and reliable results as compared to the sample method but in the sample method the errors can be easily located and rectified in the sampling methods due to the smaller number of items. Therefore, despite sample method providing lesser reliable results (as not all units are studied) yet the sample method is efficient in a sense that errors committed can be easily located.
(ii) Less Time and Energy Consuming: Sample Method involves study of fewer items of the universe. So, this method not only saves time but also energy of the investigator.
(iii) Cost Efficient: The cost of approaching each individual unit for interrogation and collection of data is comparatively lower due to small size of sample.
(iv) Lesser Non-Sampling Errors: The probability of Non-sampling Errors is also low as the sample size is smaller as compared to that of the Census Method.
(v) More Efficient: As the sample size is smaller, so the small teams of enumerators can be formed. These small teams can easily be well trained and supervised. Consequently, the team can work more efficiently than the team engaged in the Census Method.
Question 16.
(a) The average marks of 100 students in a class are 48. But while calculating it, the marks of a student were
written 73 instead of 53. Find out the corrected arithmetic mean. [3]
(b) Write four objectives of statistical average. [3]
OR
(a) Explain the merits and demerits of Arithmetic Mean?
(b) Distinguish between Census Method and Sampling Method.
Answer:
(a) Incorrect ΣX = N × X
= 100 × 48 = 4,800
Correct ΣX = 4,800 – 73 + 53 = 4,780
Correct Mean = \(\frac{\sum \mathrm{X}}{\mathrm{N}}\)
Correct Mean = \(\frac{4780}{100}\)
= 47.8
Hence, Corrected arithmetic mean is 47.80 marks.
(b) There are following four objectives of statistical average:
- To present a brief picture of data: The main purpose of average is to present a simple and systematic description of the data.
- To represent the universe: It also helps to obtain a picture of a complete group.
- Basis of statistical analysis: It is the basis of statistical analysis as it analyzes the data.
- To facilitate comparison: It helps in comparing the data of various categories.
OR
(a) Arithmetic average or mean of series of items is obtained by adding values of the items and dividing by the number of items.
Merits of Arithmetic Mean:
- To present a brief picture of data: The main purpose of average is to present a simple and systematic description of the data.
- To represent the universe: It also helps to obtain a picture of a complete group.
- Basis of statistical analysis: It is the basis of statistical analysis and analyse the data.
- To facilitate comparison: It helps in comparing
the data of various categories. (Any three)
Demerits of Arithmetic Mean:
- The arithmetic mean is highly affected by extreme values.
- It cannot average the ratios and percentages properly.
- It is not an appropriate average for highly skewed distributions.
- It cannot be computed accurately if any item is missing. (Any three)
(b) Census Method: In Census investigation or complete count, information is collected about every unit of the universe relating to the problem under investigation. Population census is such investigation.
Sampling Method: Our knowledge, our attitudes, and our actions are based on a large extent on samples. Statistical techniques have improved so greatly that it is now not necessary to investigate all the items in any group from which we may wish to collect information. Indeed, we can carry out a survey of a population by merely investigating a fraction, i.e., a sample of that population.
Question 17.
(a) Find out Mode from the following data: [3]
| Wages (in ₹) | Number of Workers |
| Upto 10 | 12 |
| Upto 20 | 30 |
| Upto 30 | 65 |
| Upto 40 | 107 |
| Upto 50 | 157 |
| Upto 60 | 202 |
| Upto 70 | 222 |
| Upto 80 | 230 |
(b) What are the general guidelines for the construction of a frequency distribution? [3]
Answer:
(a) Here, cumulative frequency is given so convert it into simple frequencies:
| Wages (in₹) | Number of Workers (f) |
| 0 – 10 | 12 |
| 10 – 20 | 18 |
| 20 – 30 | 35 |
| 30-40 | 42 |
| 40 – 50 | 50 |
| 50 – 60 | 45 |
| 60 – 70 | 20 |
| 70 – 80 | 8 |
From inspection, it is clear that modal class is 40 – 50 since it has maximum frequency.
Mode Value = L1 + \(\frac{\mathrm{f} 1-\mathrm{f} 0}{2 \mathrm{f} 1-\mathrm{f} 0 \mathrm{f} 2}\) × i
= 40 + \(\frac{50-42}{(2 \times 50)-42-45}\) × 10
Mode (Z) = 46.15
(b) The main general guidelines for the construction of a frequency distribution are:
- All class intervals should be of equal size.
- The lower limit of the first class should either be 0.5 or multiple of 5.
- We should avoid odd sized class interval.
- Open-end classes should be avoided.
Section – B
Question 18.
Identify the incorrect pair of items from the following Columns I and II: [1]
| Column I | Column II |
| A. Demand Curve | 1. Downward sloping |
| B. Indifference curve | 2. Upward rising |
| C. Marginal Utility Curve | 3. L shaped curve |
| D. Total Utility Curve | 4. Y shaped curve |
Alternatives:
(A) A – 1
(B) B – 2
(C) C – 3
(D) D – 4
Answer:
Option (A) is correct.
Explanation: The demand curve always slopes downwards from left to right because consumers will demand more goods when prices are less.
Question 19.
In case of cardinal utility approach, utility is measured in: [1]
(A) Rupees
(B) Rank
(C) Utils
(D) None of these
Answer:
Option (C) is correct.
Explanation: Utility is measured in terms of utils in case of cardinal utility approach. Models that incorporate cardinal utility use the theoretical unit of utility, the util, in the same way that any other measurable quantity is used.
Question 20.
Which of these is not a property of Indifference Curve: [1]
(A) Slopes downwards
(B) Concave to origin
(C) Two ICs cannot intersect each other
(D) Higher IC represents higher level of satisfaction
Answer:
Option (B) is correct.
Explanation: An indifference curve is convex to the origin because of diminishing marginal rate of substitution. It is downward sloping because if the quantity of one good is reduced then the quantity of the other good is increased. Therefore, an indifference curve is downward sloping and convex to the origin.
Question 21.
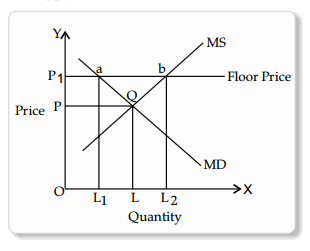
Study the following curve and answer the given question: [1]
Identify the arrow marked/shaded area in above curve:
(A) Floor Price
(B) Ceiling Price
(C) Market Price
(D) None of these
Answer:
Option (A) is correct.
Explanation: Shaded area in the given diagram represent floor price. This is fixed by the government above the equilibrium point E.
Question 22.
Read the statements Assertion (A) and Reason (R) and choose the correct alternative: [1]
Assertion (A): The difference between AC and AVC is due to AFC.
Reason (R): As output increases AFC decreases, so the difference between AC and AVC decreases.
Alternatives:
(A) Both Assertion (A) and Reason (R) are correct, and Reason (R) is the correct explanation of Assertion (A).
(B) Both Assertion (A) and Reason (R) are correct, but Reason (R) is not the correct explanation of Assertion (A).
(C) Assertion (A) is true but Reason (R) is false.
Answer:
Option (B) is correct.
Explanation: AFC falls when output is increased. Since, the Total Fixed Cost remains the same with changes in output. AFC falls steadily with increase in output. The difference between AC and AVC is due to AFC. As output increases AFC falls, so the difference between AC and AVC falls.
Question 23.
If there is no change in the demand for commodity X, even after rise in its price, then its demand is: [1]
(A) Perfectly elastic
(B) Perfectly Inelastic
(C) Highly elastic
(D) Highly Inelastic
Answer:
Option (B) is correct.
Explanation: Perfectly Inelastic Demand (Ed = 0): When change in price produces no change in demand, then such a demand is called perfectly inelastic demand. In this situation, demand curve is a straight line parallel to Y axis.
Question 24.
‘The difference between average cost and average variable cost is always constant’. [1]
Alternatives
(A) True
(B) Partly True
(C) False
(D) Can’t be predicted
Answer:
Option (C) is correct.
Explanation: The difference between AC and AVC is due to AFC. As output increases AFC falls, so the difference between AC and AVC falls.
Question 25.
What happens to TR when MR is positive? [1]
(A) TR increases
(B) TR decreases
(C) TR is maximum
(D) TR remains same
Answer:
Option (A) is correct.
Explanation: When the MR is positive TR increases. When MR is negative, TR is decreasing. When TR is maximum, MR is zero.
Question 26.
There are two statements given below, marked as Statement (I) and Statement (II). Read the statements and choose
the correct option: [1]
Statement – I: Extension and Contraction of demand occurs due to price factor.
Statement – II: When demand of a good increases due to decline in price of that good, then it is called Extension of Demand.
Alternatives
(A) Statement I is true and Statement II is false
(B) Statement I is false and Statement II is true
(C) Both statements I and II are true
(D) Both statements I and II are false
Answer:
Option (C) is correct.
Explanation: When demand of good changes due to change in its own price it is represented at different points on the same demand curve. It is called, movement along demand curve. It shows ‘Extension and Contraction’ of demand.
Question 27.
Equilibrium price falls and equilibrium quantity rises when: [1]
(A) Decrease in demand < Decrease in supply
(B) Increase in demand = Increase in supply
(C) Decrease in demand < Increase in supply
(D) Decrease in demand = Increase in supply
Answer:
Option (C) is correct.
Explanation: When the demand decreases and the supply remains the same or increases, it creates a disequilibrium leading the equilibrium prices to fall and the equilibrium quantity is to rise.
Question 28.
Market for a necessary good is competitive in which the existing firms are earning super-normal profits. How can
the policy of liberalization by the government help in making the market more competitive in the interest of the consumers? Explain. [3]
OR
How is the price of a commodity determined in a perfectly competitive market? Explain with help of a diagram.
Answer:
Policy of liberalization will remove certain barriers like licensing, quotas from the market, etc. Consequently, new firms will join the industry. This will make the market more competitive and the market supply will increase, implying a shift in the market supply curve to the right. Other things remaining constant, a rightward shift in the market supply curve will lead to a fall in equilibrium price and a rise in equilibrium quantity. Extra normal profits will ultimately be wiped out, and consumers are expected to enjoy larger quantity at a lower price.
OR
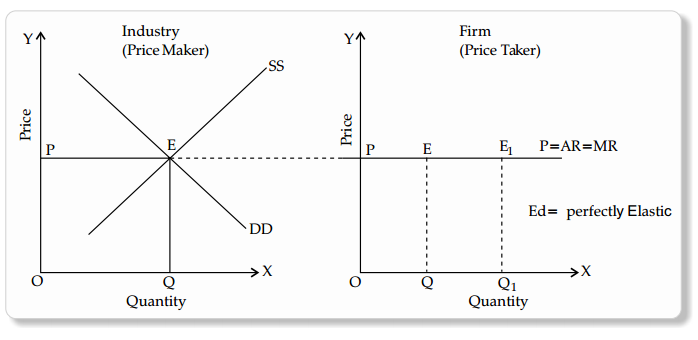
Price of a commodity is determined by market demand and market supply of a commodity, (i.e. industry is the price maker). An individual producer/ firm has no role in the determination of the price of the commodity (firm is a price taker). No individual seller or buyer can influence the price of the commodity.
Question 29.
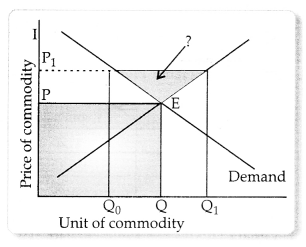
What are the effects of ‘price-floor’ (minimum price ceiling) on the market of a good? Use diagram. [3]
Answer:
Price Floor: It means the minimum price fixed by the government for a commodity in the market. It is done with a view to stabilizing income of the producers. It also helps in stabilizing the supply of the commodities in the market. Floor Price is often higher than the equilibrium price of the commodity. This is expected to cause excess supply in the market. In the figure, excess supply is equal to ab. In India, support price may be cited as an example of floor price. Support price is the assured minimum price offered by the government to the farmers for the purchase of their output. It is offered to the farmers in order to regulate their income.
Equilibrium Price = OP
Equilibrium Quantity = OL
Floor Price = OP1
Excess Supply = ab = L1L2
 im9
im9
Question 30.
The price of a commodity rises from ₹5 to ₹6 per unit and its demand falls from 100 units to 70 units. Calculate its price elasticity of demand. [4]
Answer:
Given P = ₹5, P1 = ₹ 6, Q = 100, Q1 = 70
ΔP = P1 – P = 6 – 5 = 1, ΔQ = 70 – 100 = (-) 30
Elasticity of demand = \(\frac{\text { \%Change in Q.D }}{\text { \%Change in Price }}\)
= (-) \(\frac{\Delta \mathrm{Q}}{\Delta \mathrm{P}} \times \frac{\mathrm{P}}{\mathrm{Q}}\)
Thus, Ed = (-) \(\frac{(-) 30}{1} \times \frac{5}{100}\)
= \(\frac{150}{100}\)
= 1.5
Question 31.
Calculate Marginal Cost at each level of output: [4]
| Output (Units) | Average Variable Cost (₹) |
| 1 | 12 |
| 2 | 11 |
| 3 | 10 |
| 4 | 9 |
| 5 | 9 |
| 6 | 10 |
OR
In what sense is the problem of ‘how to produce’ a central problem of an economy? Explain.
Answer:
| Output (Units) | AVC | TVC | MC = \(\frac{\Delta \mathrm{TVC}}{\Delta \mathrm{Q}}\) |
| 1 | 12 | 12 | 12 |
| 2 | 11 | 22 | 10 |
| 3 | 10 | 30 | 8 |
| 4 | 9 | 36 | 6 |
| 5 | 9 | 45 | 9 |
| 6 | 10 | 60 | 15 |
OR
The problems of how to produce is a problem relating to choice of technology. There are two techniques of production:
- Labour Intensive Technique in which labour is used more than capital.
- Capital Intensive Technique in which capital is used more than labour.
An economy must decide as to which technique is to be used so that efficient production is obtained. It is the central problem in every economy, because it impacts production (or efficiency) on one hand and the degree of employment on the other hand. Higher productivity often implies a lower degree of employment.
Question 32.
Observe the given diagram and identify the nature of curve. [4]
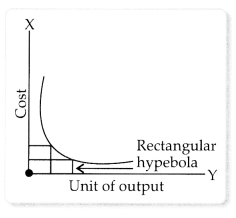
Answer:
The following curve showing the average fixed cost in short run. Per unit fixed cost is known as Average Fixed Cost. As the value of Total Fixed Cost doesn’t vary at any level of output in short run and if it is divided by an incremental number the result would be diminishing with the same proportion as that of the proportion of increase in the number of units and the product will be same. AFC as rectangular hyperbola depicts that area beneath the curve given by TFC remains constant at all points. Since TFC remains same at different levels of output, AFC falls as the level of output is increased. The AFC keeps on falling as the level of output increases. AFC can never become zero.
Question 33.
(a) Explain the conditions of producer’s equilibrium in terms of Marginal Cost and Marginal Revenue. Use a schedule. [3]
(b) There are large number of buyers in a perfectly competitive market. Explain the significance of this feature [3]
OR
(a) A consumer consumes only two goods X and Y whose prices are ₹4 and ₹5 per unit respectively. If the consumer chooses a combination of the two goods with marginal utility of X equal to 5 and that of Y equal to 4, is the consumer in equilibrium? Give reason. What will a rational consumer do in this situation? Use utility analysis.
(b) In a perfectly competitive market, the buyers treat products of all the firms as homogeneous. Explain the significance of this feature.
Answer:
(a) There are two conditions of producer’s equilibrium:
- MC = MR
- MC is greater than MR after equilibrium. The conditions are fulfilled at 4 units of output.
| Output (Units) | MC (₹) | MR (₹) |
| 1 | 12 | 10 |
| 2 | 10 | 10 |
| 3 | 9 | 10 |
| 4 | 10 | 10 |
| 5 | 13 | 10 |
(i) So long as MC is less than MR, it is profitable for the producer to go on producing more because it adds to its profits. He stops producing more when MC becomes equal to MR.
(ii) When MC is greater than MR after equilibrium, it means producing more will lead to decline in profit.
(b) The number of buyers of commodity is very large under perfect competition. It is so large that by varying its demand, an individual buyer can not affect total market demand for a commodity. Accordingly, an individual buyer can not affect market price. He can buy any quantity at the existing price of the commodity. An individual buyer is a price taker.
OR
(a) Given Px = ₹4, Py = ₹5, MUx = 5, MUy = 4
\(\frac{\mathrm{MU}_{\mathrm{x}}}{\mathrm{P}_{\mathrm{x}}}=\frac{5}{4}\) = 1.25
\(\frac{M U_Y}{P_Y}=\frac{4}{5}\) = 0.8
\(\frac{\mathrm{MU}_{\mathrm{x}}}{\mathrm{P}_{\mathrm{x}}}>\frac{\mathrm{MU}_{\mathrm{Y}}}{\mathrm{P}_{\mathrm{Y}}}\)
But the condition of equilibrium is:
\(\frac{\mathrm{MU}_{\mathrm{x}}}{\mathrm{P}_{\mathrm{x}}}>\frac{\mathrm{MU}_{\mathrm{Y}}}{\mathrm{P}_{\mathrm{Y}}}\)
The consumer is not in equilibrium. Therefore, consumer will increase consumption of Good-X in place of Good-Y.
Accordingly, MUx would start declining while MUy would start rising. The process of substituting X for Y would continue till \(\frac{M U_x}{P_x}\) (rupee worth of MUx)
and \(\frac{M U_Y}{P_Y}\) (rupee worth of MUy) are equal and the equilibrium is achieved.
(b) A product being perfectly homogeneous implies that all units of a commodity are identical in size, quality, shape, colour, weight, etc. In a state of perfect competition, a perfectly homogeneous product is sold in the market at a uniform price. If ever an individual firm tries to charge higher price, it would lose all its buyers to a large number of other sellers in the market. In a perfectly competitive environment, homogeneous product does not allow a firm any control over its price. Accordingly, firm’s demand curve (under perfect competition) becomes a horizontal straight line.
Question 34.
Read the passage given below and answer the questions that are followed.
The law of diminishing marginal product says that if we keep increasing the employment of an input, with other inputs fixed, eventually a point will be reached after which the resulting addition to output (i.e., marginal product of that input) will start falling. A somewhat related concept with the law of diminishing marginal product is the law of variable proportions. It says that the marginal product of a factor input initially rises with its employment level. But after reaching a certain level of employment, it starts falling.
On the basis of the given text and common understanding, answer the following questions:
(a) What is the Law of Diminishing Marginal Product? [2]
(b) “Marginal products in short run initially increases but after reaching a certain level of employment, it starts
falling.” [4]
Justify the above statement with the classification of different phase of production in short run.
Answer:
(a) The number of buyers of commodity is very large under perfect competition. It is so large that by varying its demand, an individual buyer can not affect total market demand for a commodity. Accordingly, an individual buyer can not affect market price. He can buy any quantity at the existing price of the commodity. An individual buyer is a price taker.
(b) Law of Variable Proportions states that as we increase quantity of only one input keeping other inputs fixed, total product (TP) initially increases at an increasing rate, then at a decreasing rate and finally at a negative rate. Phases in the law of variable proportion in terms of Marginal product:
Phase 1 : Increasing Returns to a Factor : In the first phase, every additional variable factor adds more and more to the total output. It means TP increases at an increasing rate and MP of each variable factor rises.
Phase 2 : Diminishing Returns to a Factor : In the second phase, every additional variable factor adds lesser and lesser amount of output. It means TP increases at a diminishing rate and MP falls with increase in variable factor. That is why this phase is known as diminishing returns to a factor.
Phase 3 : Negative Returns to a Factor : In the third phase, the employment of additional variable factor causes TP to decline. MP now becomes negative. Therefore, this phase is known as negative returns to a factor.