Students can access the CBSE Sample Papers for Class 11 Economics with Solutions and marking scheme Set 2 will help students in understanding the difficulty level of the exam.
CBSE Sample Papers for Class 11 Economics Set 2 with Solutions
Time : 3 Hours
Maximum Marks : 80
General Instructions:
- 1. This question paper contains two sections:
Section A – Statistics for Economics Section B – Introductory Micro Economics - This paper contains 20 Multiple Choice Questions type questions of 1 mark each.
- This paper contains 4 Short Answer Questions type questions of 3 marks each to be answered in 60 to 80 words.
- This paper contains 6 Short Answer Questions type questions of 4 marks each to be answered in 80 to 100 words.
- This paper contains 4 Long Answer Questions type questions of 6 marks each to be answered in 100 to 150 words.
Section – A
Question 1.
Read the following Statements and choose the correct alternative: [1]
Statement – I: Housewife working in the house is termed as non-economic activity.
Statement – II: An economic activity is concerned with creation of money/wealth.
Alternatives:
(A) Statement 1 is true and Statement 2 is false.
(B) Statement 1 is false and Statement 2 is true.
(C) Both Statements 1 and 2 are true.
(D) Both Statements 1 and 2 are false.
Answer:
Option (C) is correct
Explanation: Human activity by which we create some money and wealth is known as an economic activity. Services of housewife are non-economic activities.
Question 2.
Material welfare oriented definition of economics was given by: [1]
(A) Adam Smith
(B) Robinson
(C) Marshall
(D) None of these
Answer:
Option (C) is correct
Explanation: According to Marshall, “Economics is a study of mankind in the ordinary business of life. It examines that part of individual as social actions, which is most closely connected with the attainment and the use of material requisites of well-being”.
Question 3.
“Statistics is the science of average”. Whose statement is this? [1]
(A) Bowley
(B) Secrist
(C) Alligman
(D) Fisher
Answer:
Option (A) is correct
Explanation: According to A.L. Bowly: Statistics is “The science of the measurement of the social organism, regarded as a whole, in all its manifestations.”
Question 4.
Identify the correct pair of terms with their formula from the following Columns I and II: [1]
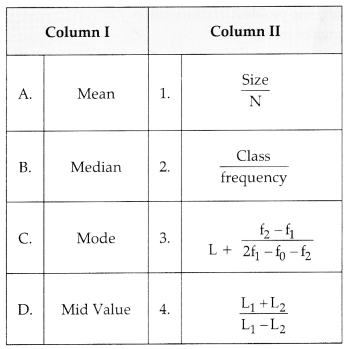
(A) A – 1
(B) B – 2
(C) C – 3
(D) D – 4
Answer:
Option (A) is correct
Explanation: Mean value is also known as athematic mean. The formula for finding mean value is strength of class divided by number of items.
Question 5.
Identify the following diagram and choose the correct alternative. [1]
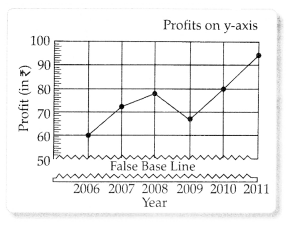
(A) Time series graph
(B) Frequency polygon
(C) Ogive
(D) Histogram
Answer:
Option (A) is correct
Explanation: The given diagrams Shows the annual profit figures of a firm with the help of a time series graph.
Question 6.
The algebraic sum of deviation of a set of n values from AM is: [1]
(A) n
(B) 0
(C) 1
(D) ∞
Answer:
Option (B) is correct
Explanation: Mean is based on all the values and so is centrally located as per the value, thus the sum of deviation from mean is zero
Question 7.
Coefficient of Correlation:
(A) Can never be negative
(B) Can never be positive
(C) May be positive or negative
(D) Always positive
Answer:
Option (C) is correct
Explanation: When there is a direct relation between two variables, there is a positive correlation. When there is an inverse relation between two variables the correlation is negative.
Question 8.
Which of the following is incorrect regarding median? Choose the correct alternatives: [1]
I. Easy to calculate and simple to understand.
II. Full of algebraic treatment
III. In order of magnitude, it divides the distribution into several parts.
IV. It is an important measure of central tendency.
Alternatives:-
(A) I and II
(B) II and III
(C) I, II and III
(D) I, III and IV
Answer:
Option (B) is correct
Explanation: Median of a series is the value of that item actual or estimated when a series is arranged in order of magnitude which divides the distribution into two parts and it is full of algebraic treatment.
Question 9.
Read the following Assertion (A) and Reason (R) and choose the correct alternative: [1]
Assertion (A): False Base Line is that portion of the scale which lies between zero and the smallest value of the variable is omitted.
Reason (R): One important rule in drawing the graph is that the vertical axis must start from zero.
Alternatives:
(A) Both Assertion (A) and Reason (R) are true, and Reason (R) is the correct explanation of Assertion (A).
(B) Both Assertion (A) and Reason (R) are true, but Reason (R) is not the correct explanation of Assertion (A).
(C) Assertion (A) is true, but Reason (R) is false.
(D) Assertion (A) is false, but Reason (R) is true.
Answer:
Option (A) is correct
Question 10.
Which of the following statements is true about the significance of Economics: [1]
(A) Economics helps in the study of the laws of motion.
(B) Economics helps in the study of man and environment.
(C) Economics helps in solving the problem of distribution.
(D) Economics helps in saving the mankind.
Answer:
Option (C) is correct.
Explanation: Yes, It is true that Economics helps in solving the problem of distribution. This can enable economic actors to make better decisions and solve problems.
Question 11.
“Economics is a science”. [3]
Do you agree with the given statement? Give valid reason in support of your answer.
Answer:
Yes. Science is the systematised body of knowledge which creates relationship between causes and their effects. In other words, every discipline which has got certain theories, concepts and laws showing the relationship between causes and effects is science. Economics has got its own theories, concepts, and laws, so it is definitely a science though not an exact science, like physics and chemistry.
Question 12.
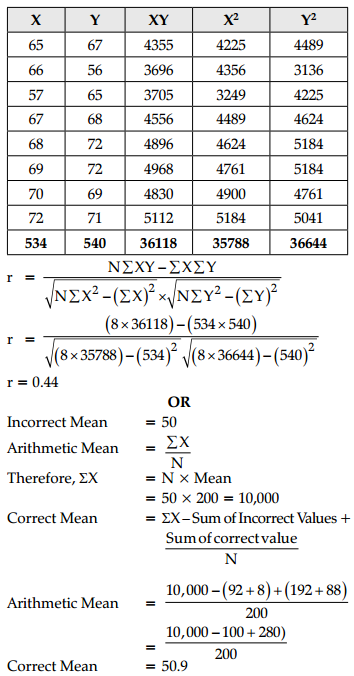
Calculate the correlation coefficient between X and Y and comment on their relationship. [3]

OR
The mean of 200 items was 50. Later it was discovered that two items were misread as 92 and 8 instead of 192 and 88. Find the correct mean.
Answer:
Question 13.
Percentage distribution of export of India is given below. Construct a pie diagram using this data: [4]
| Commodity | Group Export (in %) |
| Agriculture | 17.3 |
| Minerals | 2.6 |
| Manufactured goods | 77.8 |
| Petroleum products | 0.3 |
| Others | 2.0 |
Answer:
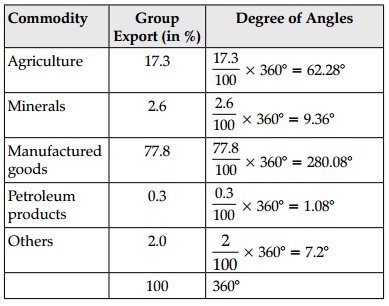
For constructing a pie diagram, it is necessary to convert the percentage into angles of different degrees.
This conversion is shown below:
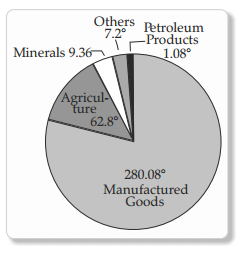
A pie diagram to show percentage distribution of export is given below:
Question 14.
(a) Find out the Median of the data given below by arranging them in ascending order: [4]
| X | Frequency |
| 160 | 5 |
| 150 | 8 |
| 152 | 6 |
| 161 | 3 |
| 156 | 7 |
OR
(b) How does the procedure of drawing a histogram differ when class intervals are unequal in comparison to equal class intervals in a frequency table?
Answer:
On arranging the data in ascending order, we get
| Class | Frequency | C.F |
| 150 | 8 | 8 |
| 152 | 6 | 14 |
| 156 | 7 | 21 |
| 160 | 5 | 26 |
| 161 | 3 | 29 |
| N = 29 |
Median = Size of \(\frac{(\mathrm{N}+1)}{2}\) th item
= Size of \(\frac{29+1}{2}\) th item
= Size of 15th item
This lies in 156
Thus, M = 156
OR
(b) A Histogram of equal class intervals has equal width of all rectangles indicating the same class intervals. In contrast, a Histogram of unequal class intervals has rectangles of varying width as per their corresponding class intervals. Before constructing a Histogram, frequencies of unequal class intervals are to be adjusted. The adjustment factor of each class is calculated with the following formula: = Adjustment factor for any class = Class Interval of the concerned class /Lowest is class Interval And the adjusted frequency will be calculated by dividing the original frequency by adjustment factor.
Question 15.
The average marks of 200 students in a class are 54. But while calculating it, the marks of a student were written 53 instead of 73. Find out the corrected arithmetic mean. [4]
Answer:
Incorrect ΣX = N × X
= 200 × 54 = 10,800
Correct ΣX = 10,800 – 53 + 73= 10,820.
Mean = \(\frac{\sum \mathrm{X}}{\mathrm{N}}\)
Mean = \(\frac{10820}{200}\)
= 54.1
Question 16.
(a) Calculate Mean and Mode from the following data: [3]

(b) Write four objectives of statistical average. [3]
OR
(a) Define Statistics and discuss its limitations?
(b) Two distributions with 100 and 200 items have a mean of 20 and 10. Find the combined mean of two distributions.
Answer:
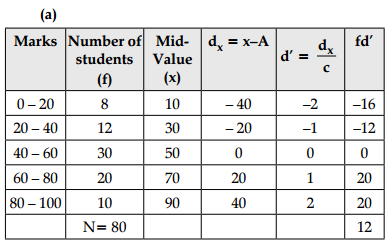
Mean = A + \(\frac{\sum \mathrm{fd}^{\prime \prime}}{\mathrm{N}}\) × C
= 50 + \(\frac{12}{80}\) × 20
= 50 + 3 = 53
Mode = L1 + \(\frac{\mathrm{f}_1-\mathrm{f}_0}{2 \mathrm{f}_1-\mathrm{f}_0-\mathrm{f}_2}\) × C
Class 40 -60 having highest frequency, thus this class is having Mode value
Mode = 40 + \(\frac{30-12}{2 \times 30-12-20}\) × 20
Mode = 40 + \(\frac{18}{60-32}\) × 20
Mode = 40 + \(\frac{18}{28}\) × 20
= 40 + 12.8
= 52.8
(b) There are following four objectives of statistical average:
- To present a brief picture of data: The main purpose of average is to present a simple and systematic description of the data.
- To represent the universe: It also helps to obtain a picture of a complete group.
- Basis of statistical analysis: It is the basis of statistical analysis as it analyse the data.
- To facilitate comparison: It helps in comparing the data of various categories. (Any three)
OR
(a) The word statistics is used both in plural as well as in singular sense. In plural sense, statistics means numeric facts which can be used to draw conclusions and in singular sense, it means the statistical methods with the help of which statistical information is used to treat and draw conclusions from them.
There are following limitations of statistics:
Sometimes, when data are not properly collected then there is likelihood to draw wrong conclusions. Therefore, it is necessary to know the limitations of statistics.
(i) Statistics does not study about individuals: Statistics are expressed in facts. It does not study individuals. For example, there are five students in a class. Statistics only tells the average marks obtained in class, not how many marks are obtained by every student in the class.
(ii) It does not study the qualitative aspect of problem: The most important condition of statistical study is that subject of investigation and inquiry should be capable of being quantitatively measured. It does not study qualitative aspects of problem, for example, honesty, poverty, etc.
(iii) Statistics can be misused: The result obtained can be manipulated according to one’s own interest and such manipulated results can mislead the community.
(iv) Statistical results lack mathematical accuracy: The results drawn from statistical analysis are normally in approximates. As the statistical analysis is based on observation of mass data, number of inaccuracies may be present and it is difficult to rectify them.
(v) Uniformity and homogeneity of data: It is essential that data must have the quality of uniformity and homogeneity. Heterogeneous data are not comparable. For example, it would be meaningless to compare the heights of men with heights of trees because these figures are of heterogeneous character.
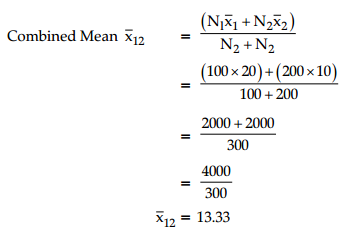
(b) Total value of Distribution 1
= 100 × 20 = 2000
Total value of Distribution 2
= 200 × 10 = 2000
Question 17.
(a) Calculate Karl Pearson’s Coefficient of Correlation from the following data: [3]

(b) Write three demerits of Arithmetic Mean [3]
Answer:
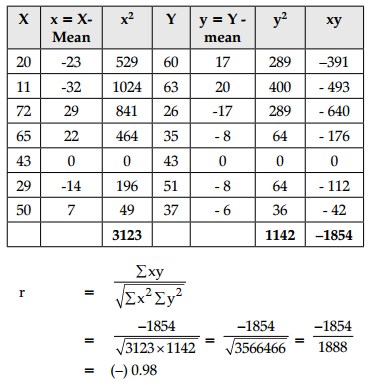
(b) Following are the four demerits of Arithmetic Mean:
- The Arithmetic Mean is highly affected by extreme values.
- It cannot average the ratios and percentages properly.
- It is not an appropriate average for highly skewed distributions. (iv) It cannot be computed accurately if any item is missing. (Any three)
Section – B
Question 18.
Identify the correct pair of items from the following Columns I and II: [1]
| Column I | Column II |
| A. Total Product | 1. Total input produced by a firm during a given period of time with given number of outputs. |
| B. Total Physical Product | 2. Total output produced by a firm during a given period of time with given number of inputs. |
| C. Average Product | 3. The change in Total Product resulting from the use of one more (or one less) unit of the variable input, keeping all other inputs constant. |
| D. Marginal Product | 4. Output per unit of a variable input. |
Alternatives:
(A) A – 1
(B) B – 2
(C) C – 3
(D) D – 4
Answer:
Option (B) is correct.
Explanation: Total product (TP) is also known as total physical product. It is the total quantity of output produced by a firm for a given quantity of inputs.
Question 19.
Identify the phase in which TP increases at an increasing rate and MP also increases. [1]
(A) Increasing returns to a factor
(B) Diminishing returns to a factor
(C) Negative returns to a factor
(D) None of these
Answer:
Option (A) is correct.
Explanation: In case of Increasing returns to a factor, TP increases at an increasing rate and MP also increases. In case of Diminishing returns to a factor, TP increases at a decreasing rate and MP starts to fall. In case of Negative returns to a factor, TP starts to decline and MP is negative.
Question 20.
Which of the following is not a central problem of an economy: [1]
(A) What to produce
(B) How to produce
(C) Where to produce
(D) For whom to produce
Answer:
Option (C) is correct.
Explanation: Central problem of an economy are – What to produce, how to produce and for whom to produce.
Question 21.
Study the following curve and answer the given question: [1]
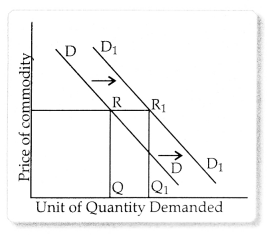
What does the above curve represent?
(A) Increase in demand
(B) Decrease in demand
(C) Extension in demand
(D) Contraction in demand
Answer:
Option (A) is correct.
Explanation: The given curve shows increase in demand. More is purchased at a same price.
Question 22.
Read the statements Assertion (A) and Reason (R) and choose the correct alternative: [1]
Assertion (A): When 5 units of a good are sold at ₹20, total revenue is ₹100.
Reason (R): Total revenue is the revenue earned by the firm from the total amount of product sold by it.
Alternatives:
(A Both Assertion (A) and Reason (R) are correct, and Reason (R) is the correct explanation of Assertion (A).
(B) Both Assertion (A) and Reason (R) are correct, but Reason (R) is not the correct explanation of Assertion (A).
(C) Assertion (A) is true but Reason (R) is false.
(D) Assertion (A) is false but Reason (R) is true.
Answer:
Option (A) is correct.
Question 23.
Identify the two cost curves which start from the same point on the Y-axis. [1]
(A) TVC and TFC
(B) TFC and TVC
(C) TFC and TC
(D) TFC and AFC
Answer:
Option (C) is correct.
Explanation: As even at 0 level of output, the firm incurs fixed cost but no variable cost, so at 0 level of output, the total fixed cost and the total cost will be equal making their curve start from the same point.
Question 24.
‘Normative economics passes value judgment regarding what is right or wrong.” [1]
Alternatives:
(A) True
(B) Partly True
(C) False
(D) Can’t be predicted
Answer:
Option (A) is correct.
Explanation: Normative economics examines real economic events from moral and ethical angles and judges whether certain economic events are desirable or not. It passes value judgment regarding what is right or wrong.
Question 25.
Market demand curve is obtained by ………………. summation of the individual demand curves. [1]
(A) Vertical
(B) Horizontal
(C) Both (A) and (B)
(D) None of these
Answer:
Option (B) is correct.
Explanation: Market demand curve is a curve showing different quantities of a commodity that all the buyers in the market are ready to buy at different possible prices of a commodity at a point of time. It is derived as a horizontal summation of individual demand curves.
Question 26.
There are two statements given below, marked as Statement (I) and Statement (II). Read the statements and choose the correct option: [1]
Statement -I: Production Possibility Curve shows different possible combinations of two goods.
Statement – II: PPC curve is based on assumption that resources are limited and constant during production.
Alternatives:
(A) Statement I is true and Statement II is false.
(B) Statement I is false and Statement II is true
(C) Both statements I and II are true
(D) Both statements I and II are false
Answer:
Option (C) is correct.
Explanation: Production Possibility Curve is a curve showing different possible combinations of two goods that can be produced with given resources and technology.
Question 27.
We can get ………….. through \(\frac{\Delta T C}{\Delta Q}\) [1]
(A) TFC
(B) TVC
(C) MC
(D) AC
Answer:
Option (C) is correct.
Explanation: MC= \(\frac{\Delta T C}{\Delta Q}\) where MC denotes
Marginal Cost, ΔTC denotes change in total cost and ΔQ denotes change in total quantity.
Question 28.
Explain any three characteristics of a perfectly competitive market? [3]
OR
Market for a good is in equilibrium. Demand for the good ‘Increases’. Explain the chain of effects of this change.
Answer:
Perfect Competition: This type of market structure refers to the market that consists of a large number of buyers and also a large number of sellers. No individual seller is able to influence the price of an existing product in the market. All sellers in a perfect competition produce homogenous outputs, i.e., the outputs of all the sellers are similar to each other and the products are uniformly priced.
Features of Perfectly Competitive Market:
(i) Large number of buyers and sellers: There exist a large number of buyers and sellers in a perfectly competitive market. The number of sellers is so large that no individual firm owns the control over the market price of a commodity. Due to the large number of sellers in the market, there exists a perfect and free competition. A firm acts as a price taker while the price is determined by the ‘invisible hands of market’, i.e., by ‘demand for’ and ‘supply of goods’. Thus, we can conclude that, under perfectly competitive market, an individual firm is a price taker and not a price maker.
(ii) Homogenous products: All the firms in a perfectly competitive market produce homogeneous products. This implies that the output of each firm is perfect substitute to others’ output in terms of quantity, quality, colour, size, features, etc. This indicates that the buyers are indifferent to the output of different firms. Due to the homogenous nature of products, existence of uniform price is guaranteed.
(iii) Free exit and entry of firms: In the long-run, there is free entry and exit of firms. However, in the short run some fixed factors obstruct the free entry and exit of firms. This ensures that all the firms in the long-run earn normal profit or zero economic profit that measures the opportunity cost of the firms either to continue production or to shut down. If there are abnormal profits, new firms will enter the market and if there are abnormal losses, a few existing firms will exit the market.
OR
Effect of an increase in demand for a commodity on equilibrium price and equilibrium quantity is discussed with reference to Fig. given below:
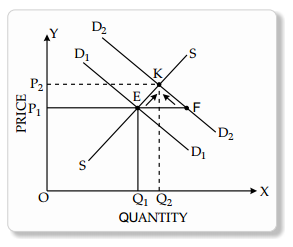
In Fig. D1D1 is the initial demand curve crossing supply curve SS at point E, the point of initial equilibrium. Owing to increase in demand, demand curve shifts to the right, from D1D1 to D2D2. At the existing price (OP1), quantity rises from point E to point F. As an immediate impact of increase in demand, there is excess demand in the market, equal to EF (at the existing price). Due to the pressure of demand, price of the commodity tends to be higher than the equilibrium price. Owing to rising price, quantity demanded tends to contract. Contraction of demand occurs from point F towards point K. However, at rising price, quantity supplied tends to extend. The extension of supply occurs from point E towards point K. The process of extension of supply and contraction of demand (triggered by the rising price) continues till excess demand is fully tackled and the market clears itself once again. K is the point of new equilibrium, where quantity supplied is equal to quantity demanded. Corresponding to the new equilibrium, quantity demanded/supplied is equal to OQ2, and equilibrium price is OP2.
Thus, the net effect of increase in demand is:
(i) Increase in equilibrium price from OP1 to OP2, and
(ii) Increase in equilibrium quantity from OQ1 to OQ2.
Question 29.
Explain the meaning and need for ‘price ceiling’. [3]
Answer:
Price ceiling: It refers to the maximum price of a commodity that the sellers can charge from the buyers. Often, the government fixes this price much below the equilibrium market price so that the essential commodities are within the reach of the poorer sections of the society. When ceiling price is lower than the equilibrium price, there is likely to be excess demand in market and vice-versa.
Question 30.
As a result of 10% rise in price of commodity X, its demand falls from 200 units to 190 units. Calculate its price elasticity of demand. [4]
Answer:
Change in quantity demanded
= \(\frac{190-200}{200}\) × 100
= (-) 5%
Elasticity of demand = \(\frac{\% \text { Change in Q.D }}{\text { \% Change in Price }}\)
= (-) \(\frac{\Delta Q}{\Delta P} \times \frac{P}{Q}\)
Thus, Ed = \(\frac{-5}{10}\)
= (-) 0.5%
Question 31.
Calculate average variable cost at each level of output: [4]
| Output (Units) | Marginal Cost (₹) |
| 1 | 15 |
| 2 | 12 |
| 3 | 9 |
| 4 | 14 |
| 5 | 21 |
| 6 | 31 |
OR
Explain any three factors that determine supply of a commodity.
Answer:
| Output (Units) | Marginal Cost (₹) | TVC | AVC |
| 1 | 15 | 15 | 15 |
| 2 | 12 | 27 | 13.5 |
| 3 | 9 | 36 | 12 |
| 4 | 14 | 50 | 12.5 |
| 5 | 21 | 71 | 14.2 |
| 6 | 31 | 102 | 17 |
OR
Factors Affecting Supply : The various factors affecting supply of a commodity are :
(i) Own Price of a Commodity (Px) : There is a direct relationship between own price of a commodity and its quantity supplied. Higher the price, higher the quantity supplied and vice-versa.
(ii) Price of Related Goods (PR) : The supply of a particular commodity is inversely related with the price of its substitute commodities, such as the supply of wheat will fall with rise in the price of rice, i.e., supply decreases and vice- versa. In case of complementary goods, supply is directly related with the price of complementary goods. With rise in price of petrol, supply of cars will rise, i.e., supply increases and vice-versa.
(iii) Goal of the Firm (G) : The goal of the firm is to maximise profits. More quantity of the commodity will be offered only at a higher price. On the other hand, if goal of the firm is to maximise sales, more will be supplied even at the same price and same will be supplied even at a reduced price. Sales maximiser firm supplies greater quantity than a profit maximiser firm.
Question 32.
Observe the given diagram and answer the question.
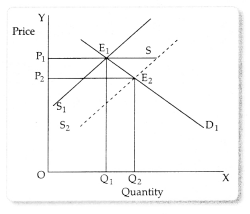
It is expected that replacement of all existing taxes on good X by the proposed single goods and service tax (GST) will bring down overall tax on good X substantially. Explain its likely chain of effects on price and quantity of good X.
Answer:
Lower tax shifts supply curve S1 to S2. This creates excess supply ‘E1S’ at price P1. It leads to competition among producers. As a result price falls. Supply falls along the curve S2and demand rises along the curve D1. This continues till demand equals supply at E2. Price falls to OP2 and quantity rises to OQ2.
Question 33.
(a) Explain the characteristics of Indifference Curves. [3 + 3 = 6]
(b) An individual is both the owner and the manager of shop taken on rent. Identify implicit cost and explicit cost 1 from this information. Explain.
OR
(a) Why do central problems of an economy arise?
(b) Explain the central problem of ‘for whom to produce”
Answer:
Properties of Indifference Curve:
- Indifference Curves are negatively sloped or they slope downwards: It shows that more of one commodity implies less of the other, so that the total satisfaction (at any point on Indifference Curve) remains the same.
- Indifference Curves are convex to the point of origin: An Indifference Curve will ordinarily be convex to the origin. This is because of Diminishing Marginal Rate of Substitution.
- Indifference Curve neither touches X-axis nor Y-axis : It is often assumed that a consumer buys a combination of two goods. Hence, an Indifference Curve neither touches X-axis nor Y-axis.
- Indifference Curves never touch or intersect each other: Each Indifference Curve represents a different level of satisfaction. So, their intersection is ruled out.
- Higher Indifference Curve represents higher level of satisfaction: This is based on the assumption of monotonic preferences which means that greater consumption of a commodity by the consumer gives higher level of satisfaction.
(b) In the given case, rent paid for a shop is explicit cost because it is the expense incurred by the producer for purchasing the inputs from market. As a manager, the owner is rendering his own services. Managerial services are not hired from the market. So they are implicit cost as these costs are incurred on the use of self- owned inputs.
OR
(a) Central problems of an economy arises due to the following reasons :
- Limited or Scarce Resources : Resources are scarce in relation to our wants and economy cannot produce all what people want. It is the principle reason for existence of economic problems in all economies.
- Alternative Uses : Resources can be put to alternative uses. For example land is used not only for the production of crops but also for construction of buildings and factories. As a result, the economy has to make a choice between the alternative uses of the given resources.
- Unlimited Wants : Human wants are unlimited in number. They are never ending and they can never be fully satisfied.
(b) For Whom to Produce : This problem is concerned with the distribution of income in an economy. It is concerned with whether to produce goods for high-income groups or low-income groups. The capacity of people to pay for goods depends upon their level of income. Thus, this problem is concerned with distribution of income among factors of production who contribute in the production process. It has two aspects :
- Personal distribution : It means how national income of an economy is distributed among different groups of people in the society.
- Factorial distribution : It relates to income share of different factors of production such as wages for labour, interest for capital, rent for land, etc.
Question 34.
Read the passage given below and answer the questions that are followed:
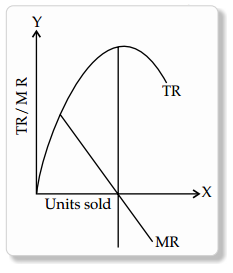
The slope of a total revenue curve is particularly important. It equals the change in the vertical axis (total revenue) divided by the change in the horizontal axis (quantity) between any two points. The slope measures the rate at which total revenue increases as output increases. We can think of it as the increase in total revenue associated with a 1-unit increase in output. The increase in total revenue from a 1-unit increase in quantity is marginal revenue. Thus marginal revenue (MR) equals the slope of the total revenue curve.
How much additional revenue does a radish producer gain from selling one more pound of radishes? The answer, of course, is the market price for 1 pound. Marginal revenue equals the market price. Because the market price is not affected by the output choice of a single firm, the marginal revenue the firm gains by producing one more unit is always the market price. The marginal revenue curve shows the relationship between marginal revenue and the quantity a firm produces. For a perfectly competitive firm, the marginal revenue curve is a horizontal line at the market price. If the market price of a pound of radishes is $0.40, then the marginal revenue is $0.40. Marginal revenue curves for prices of $0.20, $0.40, and $0.60. In perfect competition, a firm’s marginal revenue curve is a horizontal line at the market price.
Price also equals average revenue, which is total revenue divided by quantity. To obtain average revenue (AR), we divide total revenue by quantity, Q. Because total revenue equals price (P) times quantity (Q), dividing by quantity leaves us with price.
On the basis of the given text and common understanding, answer the following questions:
What change should take place in total revenue when :
(i) Marginal revenue is positive and constant, and
(ii) Marginal revenue is falling. [2]
What is the relationship between:
(i) Marginal Revenue and Average Revenue
(ii) Total Revenue and Marginal Revenue [4]
Answer:
(a) (i) When MR is positive and constant, TR should increase at a constant rate.
(ii) When MR is falling, TR should increase at a decreasing rate.
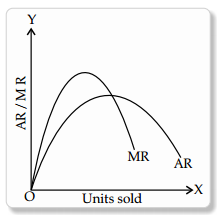
(b) (i) MR and AR : The relationship between AR and MR depends on whether the price remains same or falls with rise in output.
(A) AR increases as long as MR is higher than AR.
(B) AR is maximum and constant when MR is equal to AR.
(C) AR falls when MR is less than AR.
(ii) TR and MR :
(A) As long as MR is positive, TR increases.
(B) When MR is zero, TR is at its maximum point.
(C) When MR becomes negative, TR starts falling.
