These Class 9 AI Important Questions Chapter 3 Math for AI Class 9 Important Questions and Answers NCERT Solutions Pdf help in building a strong foundation in artificial intelligence.
Math for AI Class 9 Important Questions
Class 9 Math for AI Important Questions
Important Questions of Math for AI Class 9 – Class 9 Math for AI Important Questions
Math for AI Class 9 Very Short Answer Type Questions
Question 1.
What is the mean in statistics?
Answer:
The average of a set of numbers.
Question 2.
Define median,
Answer:
The middle value in a sorted list of numbers.
Question 3.
What is the mode?
Answer:
The value that appears most frequently in a dataset.
Question 4.
What is standard deviation?
Answer:
A measure of the amount of variation or dispersion in a set of values.
![]()
Question 5.
What does a histogram represent?
Answer:
The distribution of numerical data.
Question 6.
What is a population in statistics?
Answer:
The entire group from which a sample is taken.
Question 7.
What is probability?
Answer:
The likelihood of an event occurring.
Question 8.
Define an independent event.
Answer:
An event that is not affected by other events.
Question 9.
Define an dependent event.
Answer:
An event that is influenced by other events.
Question 10.
What is a probability distribution?
Answer:
A function that describes the likelihood of different outcomes.
Question 11.
What is a random variable?
Answer:
A variable whose values depend on outcomes of a random phenomenon.
![]()
Question 12.
What is a uniform distribution?
Ans.
A distribution where all outcomes are equally likely.
Question 13.
What is a binomial distribution?
Answer:
A distribution representing the number of success in a fixed number of independent Bernoulli trials.
Question 14.
What is a normal distribution?
Answer:
A bell-shaped distribution that is symmetric about the mean.
Question 15.
What is a scatter plot used for?
Answer:
To show the relationship between two variables.
Math for AI Class 9 Short Answer Type Questions
Question 1.
What is Neural Network?
Answer:
An artificial intelligence technique called a neural network instructs computers to analyse data in a manner modelled after the human brain. Deep learning is a type of machine learning that employs interconnected neurons or nodes in a layered structure to mimic the human brain.
Question 2.
What are nodes?
Answer:
Each layer of a neural network is further divided into a number of nodes, or little building blocks. Each node must complete a certain duty before sending the resulting output to the following layer.
Question 3.
What is statistics?
Answer:
Statistics is a branch of mathematics that involves the collection, analysis, interpretation, presentation, and organization of data. It provides methodologies for making inferences about a population based on a sample, helping to understand and quantify variability, patterns, and relationships in data.
![]()
Question 4.
What is probability?
Answer:
Probability is a branch of mathematics that deals with the measurement and analysis of uncertainty and randomness. It quantifies the likelihood of events occurring and provides a framework for reasoning about uncertainty.
Math for AI Class 9 Long Answer Type Questions
Question 1.
Why Neural Network is important? And its applications
Answer:
Computers can make intelligent judgements with the help of neural networks and little human input. This is due to the fact that they have the ability to learn and model. complicated, nonlinear correlations between input and output data.
There are three types of applications of Neural Networks:
(i) Facial recognition- These days, cameras on smart phones may infer a person’s age from their facial features. Neural networks are in action here. separating the face from the background first, and then determining your age from the lines and spots on your face.
(ii) Forecasting- The ability of neural networks to comprehend patterns and predict the likelihood of rainfall or a rise in stock prices is highly accurate.
(iii) Music Composition- Even music patterns can be learned by neural networks, and they can become skilled enough to create original music.
Question 2.
What are the advantages of Neural Network?
Answer:
Below are the advantages of Neural Network.
Parallel processing capability-A very powerful system, artificial neural networks can handle multiple tasks at once.
Data is stored on the entire network- Since the data is accessible throughout the entire network, the system will continue to function even if one node goes down or is inaccessible.
Capable of learning from non-linear and complex data-The input can be complex and non-linear for ANN to use it to generate the desired output.
![]()
Question 3.
Types of AI Models and explain them.
Answer:
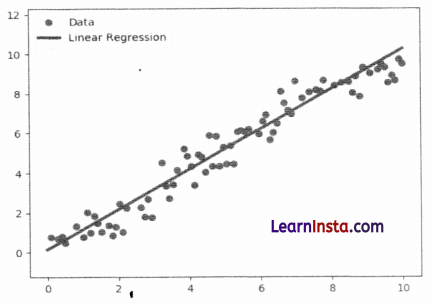
There are three types of AI models i.e. Regression, classification and clustering.
Regression-Regression is an example of rule based AI models. In regression, the algorithm generates a mapping function from the given data, as shown by the solid line in the given graph.
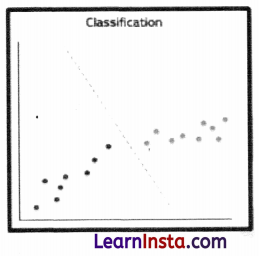
Classification-Classification is another rule based AI model. It is a systematic grouping of observations in categories, something like categorizing plants, animals in different taxonomies by biologists. In classification you teach the machine to perform with labeled data.
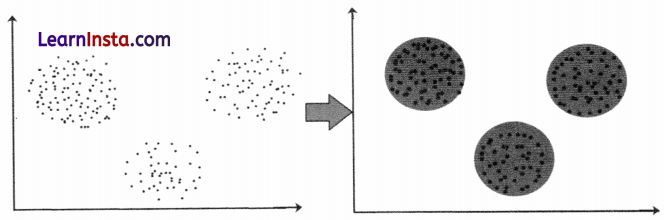
Clustering-Clustering is a machine learning approach where the machine partitions the dataset into different clusters or categories based on machine generated algorithms.
Question 4.
At which stage of the AI project cycle does Tableau software prove useful?
Tableau software proves useful during the Data Exploration and Data Visualization stages of the AI project cycle.
Data Exploration:
Exploring Data: Tableau allows users to interactively explore large datasets, identify patterns, trends, and outliers, and gain preliminary insights.
Interactive Analysis: Users can create visual representations of the data to understand its structure, distribution, and key characteristics.
Data Visualization:
Creating Visuals: Tableau is highly effective for creating various types of charts, graphs, and dashboards that communicate insights clearly and effectively.
Sharing Insights: It provides tools for building interactive visualizations that can be shared with stakeholders to convey findings and support decision-making.
Question 5.
Name any five graphs that can be made using Tableau software
Here are five types of graphs that can be created using Tableau software:
Bar Chart:
Used to compare different categories or groups.
Suitable for displaying discrete data.
Line Chart:
Ideal for showing trends over time.
Commonly used for time series data.
Pie Chart:
Displays the proportion of categories as slices of a pie.
Useful for showing relative percentages of a whole.
Scatter Plot:
Shows the relationship between two continuous variables.
Useful for identifying correlations and trends.
Heat Map:
Uses color to represent data density or intensity.
Effective for visualizing complex data patterns and correlations.
![]()
Question 6.
Does math play a crucial role in AI life cycle?
Yes, math plays a crucial role in the AI lifecycle. Here are some key areas where math is essential:
1. Algorithms and Models:
Linear Algebra: Used in the representation and computation of data in models, such as vectors and matrices, which are fundamental in machine learning algorithms.
Calculus: Necessary for optimization techniques used in training models, such as gradient descent, which relies on derivatives and integrals.
Probability and Statistics: Vital for making predictions and inferences from data, assessing model performance, and handling uncertainty and variability in data.
2. Data Preprocessing:
Statistical Methods: Used to clean, normalize, and transform data, ensuring it is suitable for modeling.
Dimensionality Reduction: Techniques like Principal Component Analysis (PCA) rely on linear algebra to reduce the number of features while retaining essential information.
3. Model Training and Evaluation:
Optimization: Mathematical optimization techniques are used to minimize or maximize an objective function during model training.
Error Metrics: Calculated using statistical methods to evaluate model performance, such as Mean Squared Error (MSE) or classification accuracy.
4. Feature Engineering:
Mathematical Transformations: Applying mathematical functions to create new features from raw data, which can improve model performance.
5. Advanced AI Techniques:
Neural Networks: Deep learning relies heavily on linear algebra and calculus for operations like matrix multiplications and backpropagation.
Bayesian Networks: Use probability theory to model relationships between variables and make predictions based on incomplete data.
6. Interpretability and Explanation:
Statistical Analysis: Helps in interpreting model outputs and understanding the relationships between features and predictions.
![]()
Question 7.
Explain the relationship between Mathematics and Artificial Intelligence, providing justification for their interconnection.
Mathematics and Artificial Intelligence (AI) are deeply interconnected, with mathematics serving as the foundational framework for many AI techniques and algorithms. Here’s an explanation of their relationship and justification for their interconnection:
1. Mathematics as the Language of AI:
Mathematics provides the formal language and tools for expressing and understanding the principles, algorithms, and models used in AI.
2. Machine Learning and Statistical Methods:
Machine learning, a core subset of AI, relies heavily on statistical methods and probabilistic models for learning from data and making predictions.
3. Optimization Techniques:
Optimization, another essential component of AI , uses mathematical methods to find the best solution to a problem among a set of possible solutions.
4. Linear Algebra in Neural Networks:
Linear algebra plays a central role in the design and implementation of neural networks, the building blocks of deep learning.
5. Probability and Uncertainty:
Probability theory is essential for handling uncertainty in AI systems, modeling stochastic processes, and making decisions under uncertainty.
6. Complex Systems Modeling:
Mathematics provides tools for modeling complex systems, such as dynamical systems theory and graph theory, which are used in AI for modeling social networks, biological systems, and complex adaptive systems.
Justificatiqn for Interconnection:
Theoretical Foundation: Mathematics provides a rigorous theoretical foundation for understanding AI concepts, algorithms, and techniques.
Algorithm Development: Many AI algorithms and techniques are formulated and analyzed using mathematical principles, ensuring their correctness, efficiency, and effectiveness.
Cross-Disciplinary Collaboration: The intersection of mathematics and AI fosters collaboration between mathematicians, computer scientists, statisticians, and domain experts, leading to interdisciplinary research and innovation.
Advancements in AI: Mathematical advancements drive advancements in AI, enabling the development of more sophisticated algorithms, models, and systems with improved performance and capabilities.
Question 8.
Aman is confused, how probability theory is utilized in artificial intelligence, help Aman by providing two examples to illustrate its importance
Here are two examples illustrating how probability theory is utilized in artificial intelligence:
1. Bayesian Inference in Spam Filtering:
Example: Consider a spam filtering system that classifies emails as either spam or nonspam (ham). The system uses Bayesian inference to probabilistically determine the likelihood that an email is spam based on its content and features.
Importance: Bayesian inference allows the system to update its beliefs about the probability of an email being spam as it observes new evidence (e.g., words in the email, sender’s address).
Implementation: The system maintains prior probabilities of spam and non-spam emails and updates these probabilities using Bayes’ theorem ‘as new evidence (features) are observed. It calculates the posterior probability of an email being spam given its features and compares it to a threshold to make a classification decision.
2. Markov Decision Processes in Reinforcement Learning:
Example: In reinforcement learning, an agent learns to make decisions by interacting with an environment to maximize cumulative rewards. Markov decision processes (MDPs) model such sequential decision-making tasks probabilistically.
Importance: Probability theory, particularly the Markov property, allows the agent to model the uncertainty inherent in the environment’s dynamics and the stochasticity of actions’ outcomes.
![]()
Implementation: The agent maintains a probability distribution over possible states and actions and learns to update its policy based on observed rewards and transitions between states. By estimating the expected rewards of different actions in different states probabilistically, the agent learns an optimal policy to achieve its goals over time.
Question 9.
Define Certain events and likely events with examples
In probability theory, events are classified based on their likelihood of occurrence. Here are definitions and examples of certain events and likely events:
1. Certain Event:
Definition: A certain event is an event that is guaranteed to occur, meaning it has a probability of 1(P=1).
Example:
Rolling a fair six-sided die and getting a number between 1 and 6 is a certain event because it is guaranteed to happen on every roll.
Drawing a red ball from a bag containing only red balls is also a certain event since there are no other possibilities.
2. Likely Event:
Definition: A likely event is an event that has a high probability of occurring, but it is not guaranteed to happen ( O<P<1 ).
Example:
Flipping a fair coin and getting heads is a likely event because there is a 50 % chance (P=0.5 ) of it happening on each flip.
Drawing a card from a standard deck and getting a face card (jack, queen, or king) is a likely event because there are 12 face cards out of 52 total cards, giving it a probability of 3 / 13 approx 0.231.
Question 10.
Identify the likely, unlikely, impossible and equal probability events from the following
a. Tossing a coin
b. Rolling an 8 on a standard die
c. Throwing ten 5’s in a row
d. Drawing a card of any suite
Answer:
a. Tossing a Coin:
- Likely Event: Getting either heads or tails since both outcomes are equally probable. (Equal probability event)
- Unlikely Event: Getting the coin to stand perfectly on its edge. (Unlikely because it’s a rare occurrence)
- Impossible Event: Getting both heads and tails simultaneously. (Impossible because the coin can only land on one side)
Equal Probability Event: Getting either heads or tails since both outcomes have the same probability.
b. Rolling an 8 on a Standard Die:
- Likely Event: Getting a number between 1 and 6 (e.g., 1, 2, 3, 4, 5, or 6 ) since these are the possible outcomes on a standard die. (Equal probability event)
- Unlikely Event: Getting a negative number or a fraction since these are not possible outcomes on a standard die. (Unlikely because it’s not within the range of possible outcomes)
- Impossible Event: Getting an 8 since a standard die has only 6 faces numbered 1 through 6. (Impossible because it’s not within the range of possible outcomes)
- Equal Probability Event: Getting any number between 1 and 6 since each face of the die has the same probability of landing face up.
c. Throwing Ten 5’s in a Row:
- Likely Event: Throwing any other number besides 5 since there are five other possible outcomes on a standard die. (Equal probability event)
- Unlikely Event: Throwing ten 5 ‘s in a row since it requires a specific outcome on each throw. (Unlikely because the probability decreases with each consecutive throw)
- Impossible Event: Throwing a 7 on a standard die since it’s not a possible outcome. (Impossible because it’s not within the range of possible outcomes)
- Equal Probability Event: Throwing any number between 1 and 6 since each face of the die has the same probability of landing face up.
![]()
d. Drawing a Card of Any Suit:
- Likely Event: Drawing a red card or a black card since each suit contains both red and black cards. (Equal probability event)
- Unlikely Event: Drawing a specific card (e.g., the ace of spades) since it’s only one card out of 52. (Unlikely because the probability is low)
- Impossible Event: Drawing a card that is both red and black at the same time. (Impossible because a card can only belong to one suit)
- Equal Probability Event: Drawing any card from the deck since each card has the same probability of being drawn.
Math for AI Class 9 Case-Based Questions
Question 1.
Predicting House Prices
Question:
An AI model is being developed to predict house prices based on features such as square footage, number of bedrooms, location, and age of the house. The dataset contains 10,000 records. What statistical methods should be used to preprocess the data and build a robust predictive model?
Answer:
Data Cleaning: Handle missing values through imputation (e.g., mean/median for numerical features, mode for categorical features).
Exploratory Data Analysis (EDA): Visualize data distributions and relationships between features using histograms, scatter plots, and correlation matrices.
- Feature Scaling: Normalize or standardize numerical features to ensure they are on a comparable scale.
- Feature Engineering: Create new features that might improve the model, such as price per square foot or age categories.
- Model Selection: Use regression techniques like Linear Regression, Decision Trees, or advanced methods like Random Forest or Gradient Boosting.
- Model Validation: Split the data into training and test sets (e.g., 8o-20 split) and use cross-validation to evaluate model performance.
- Performance Metrics: Use metrics like Mean Absolute Error (MAE), Mean Squared Error (MSE), and R-squared to assess model accuracy.
Question 2.
Customer Churn Prediction
Question:
A telecommunications company wants to predict customer churn (whether a customer will leave the service). They have historical data including customer demographics, usage patterns, service history, and previous churn status. How should they use statistics and probability to approach this problem?
Answer:
- Data Exploration: Perform EDA to understand the distribution of churn and non-churn customers and identify key differentiating factors.
- Class Imbalance: Check for class imbalance (churn vs. non-churn) and use techniques like SMOTE (Synthetic Minority Over-sampling Technique) if necessary.
- Feature Selection: Use statistical tests (e.g., chi-square test for categorical features, t-test for numerical features) to select features that significantly affect churn.
- Probability Models: Apply logistic regression to estimate the probability of churn based on the selected features.
- Machine Learning Models: Explore other classification algorithms like Decision Trees, Random Forests, and Support Vector Machines (SVM) to improve prediction accuracy.
- Evaluation Metrics: Use metrics such as Precision, Recall, F1-score, and ROC-AUC to evaluate model performance, especially due to potential class imbalance.
![]()
Question 3.
A/B Testing for Website Optimization
Question:
An e-commerce website wants to determine whether a new layout improves user engagement compared to the current layout. They conduct an A / B test where half the users see the new layout (Group B) and the other half see the current layout (Group A). What statistical methods should be used to analyze the results?
Answer:
Hypothesis Testing: Formulate null and alternative hypotheses (e.g., HoH_oHo:-New layout does not improve engagement, H1H_1 H_1: New layout improves engagement).
Data Collection: Ensure random assignment of users to control and treatment groups to eliminate bias.
Descriptive Statistics: Calculate mean engagement metrics (e.g., time spent on site, number of pages visited) for both groups.
T-Test: Use a two-sample t-test to compare the means of the two groups and determine if the difference is statistically significant.
P-Value: Evaluate the p-value to decide whether to reject the null hypothesis (typically using a significance level of o.05).
Effect Size: Calculate the effect size to understand the practical significance of the result.
Question 4.
Fraud Detection
Question:
A bank wants to develop an AI model to detect fraudulent transactions. They have transaction data including transaction amount, time’, location, and customer details. What steps involving statistics and probability should they take to build this model?
Answer:
- Data Preprocessing: Clean the data by handling missing values and outliers. Encode categorical features appropriately.
- Exploratory Data Analysis: Investigate the distribution of fraudulent vs. non-fraudulent transactions and identify suspicious patterns.
- Feature Engineering: Create features like transaction frequency, average transaction amount, and deviations from typical spending behavior.
- Class Imbalance: Address the imbalance between fraudulent and non-fraudulent transactions using techniques like oversampling or undersampling.
- Probability Models: Apply probabilistic models like Naive Bayes to predict the likelihood of a transaction being fraudulent.
- Advanced Models: Use machine learning models such as Random Forests, Gradient Boosting Machines, or neural networks for improved detection.
- Evaluation Metrics: Focus on metrics such as Precision, Recall, F1-score, and ROC-AUC, as accuracy might be misleading due to class imbalance.
Question 5.
Quality Control in Manufacturing
Question:
A manufacturing company collects data on product dimensions, weight, and defect rates from their production line. They want to identify the factors that lead to defective products. How should they use statistical analysis to achieve this?
Answer:
- Data Exploration: Perform EDA to visualize the distribution of dimensions, weight, and defect rates.
- Descriptive Statistics: Calculate summary statistics (mean, median, variance) for both defective and non-defective products.
- Correlation Analysis: Analyze the correlation between product dimensions/weight and defect rates to identify potential causes.
- Statistical Tests: Use hypothesis testing (e.g., ANOVA) to determine if differences in dimensions or weight are statistically significant between defective and non-defective products.
- Regression Analysis: Apply logistic regression to model the probability of a defect occurring based on dimensions and weight.
- Control Charts: Use control charts to monitor production processes and identify any variations that exceed acceptable limits.
![]()
Question 6.
A group of Class 9 students decided to create a simple AI model to predict whether it would rain on a given day based on past weather data. They collected data on temperature, humidity, wind speed, and precipitation for the past year. The students used this data to calculate statistical measures such as mean, median, mode, and standard deviation for each weather parameter. They then analyzed the probability of rain given certain conditions using conditional probability. Based on their analysis, they trained a basic AI model to maké predictions.
Question.
What statistical measures did the students calculate, and why are these measures important in data analysis?
Answer:
Statistical Measures Calculated:
- Mean: The average value of each weather parameter, providing a central tendency of the data.
- Median: The middle value that separates the higher half from the lower half of the data set, useful for understanding the typical value.
- Mode: The most frequently occurring value in the data set, indicating common conditions.
- Standard Deviation: A measure of the amount of variation or dispersion in the data, indicating how spread out the values are.
These measures are important because they provide a summary of the data and help in understanding the overall patterns and variability.
Question.
Explain how the students used conditional probability to analyze the likelihood of rain.
Answer:
Using Conditional Probability:
The students calculated the probability of rain given certain conditions (e.g., high humidity, low temperature) by using the formula for conditional probability: P(A | B)=P(A ∩ B) P(B) P(A|B) = \frac {P(A \cap B)}{P(B)} P(A|B) = P(B) P(A ∩ B).
They analyzed the frequency of rain occurring under specific weather conditions to estimate the likelihood of rain based on those conditions.
Question.
Describe the steps the students took to prepare the data for training their AI model.
Answer:
Steps to Prepare Data for AI Model Training:
- Data Collection: Gathered past weather data including temperature, humidity, wind speed, and precipitation.
- Data Cleaning: Removed any incomplete or erroneous entries to ensure the data quality.
- Data Normalization: Standardized the data to bring all parameters to a comparable scale.
- Feature Selection: Identified relevant features (weather parameters) that influence the likelihood of rain.
- Splitting the Data: Divided the data into training and testing sets to evaluate the model’s performance.
Question.
What is the significance of standard deviation in understanding the weather data?
Answer:
Significance of Standard Deviation:
- Standard deviation helps in understanding the variability of the weather data. A high standard deviation indicates that the weather parameters vary widely, while a low standard deviation indicates that they are more consistent.
- It helps in identifying how much the actual weather conditions deviate from the average conditions.
![]()
Question.
How can probability concepts help in making predictions using AI?
Answer:
Using Probability Concepts in AI Predictions:
- Probability concepts help in estimating the likelihood of different outcomes based on historical data.
- By understanding the probability of rain únder various conditions, the AI model can make informed predictions.
- These concepts are fundamental in developing predictive models that can handle uncertainty and variability in real-world data.
Math for AI Class 9 Notes
Statistics- Statistics is used for collecting, exploring, and analyzing the data and it helps in drawing various data.
Applications of Statistics-:
- Predict the performance of sports teams.
- It can be used to find our specific things such as:
- The reading level of students
- The opinions of voters
- The average weight of a city’s resident
Applications of Neural Network-Facial recognition, Forecasting and Music Composition
Advantages of Neural Network- Parallel processing capability, Data is stored on the entire network and Capable of learning from non-linear and complex data.
Types of AI Models- Regression, Classification and Clustering.
Definition Human Nervous System- Neurons, a complex network of specialised nerve cells, make up the Human Nervous System. The neurons that make up the nervous system are in charge of sending messages throughout the body.
Types of Neural Network-There are mainly two types of Neural Networks:
- Artificial Neural Network
- Biological Neural Network