These Class 9 AI Important Questions Chapter 2 Data Literacy Class 9 Important Questions and Answers NCERT Solutions Pdf help in building a strong foundation in artificial intelligence.
Data Literacy Class 9 Important Questions
Class 9 AI Data Literacy Important Questions
Important Questions of Data Literacy Class 9 – Class 9 Data Literacy Important Questions
Data Literacy Class 9 Very Short Answer Type Questions
Question 1.
What is data literacy?
Answer:
The ability to read, understand, create and communicate data as information.
Question 2.
Why is data literacy important?
Answer:
It enables individuals to make informed decisions based on data analysis.
![]()
Question 3.
What are the types of data collected in data acquisition stage?
Answer:
In data acquisition the following types of data are mostly collected:
- Textual data
- Numeric type data
- Structured data
- Big data type
Question 4.
Who are the stake holders in the problem scoping stage?
Answer:
The stake holders in the problem scoping are :
| Our | Stakeholders | Who |
| Has/Have problem that | [Issue, problem, need] | What |
| When/While | [Context, situation] | Where |
| An ideal solution would | Benefit of solution for them] | Why |
Question 5.
What is system map?
Answer:
System map is a tool that helps to show the relationship among the elements in a graphical form. It helps in finding out a possible solution of a problem in an easy manner using graphics.
Question 6.
Is system map necessary?
Answer:
System map is necessary to analyzing the problem and to identify various elements that constitutes the problem. Its mostly used in problem scoping stage.
Question 7.
What is problem scoping?
Answer:
Problem scoping refers to the identification of a problem and to find out the possible solutions to solve the problem. It is the very first stage of any project.
![]()
Question 8.
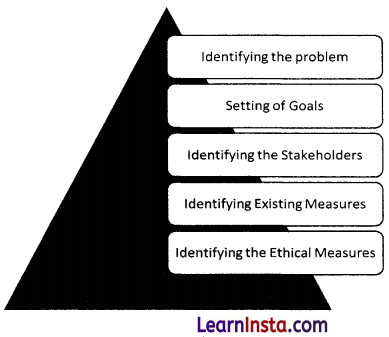
What are the key steps involved in problem scoping?
Answer:
The various steps involved in problem scoping are:
Question 9.
Name the different stages involved in the AI project cycle?
Answer:
- Problem Scoping
- Data Acquisition
- Data Exploration
- Data Modelling
- Evaluation
Question 10.
What do you understand by the term project cycle?
Answer:
Project cycle defines each and every step that every organisation follows to derive the business value and to gather benefits for the organisation.
Question 11.
What is big data?
Answer:
Big data usually refers to large amount of data that are collected, however cannot be stored in traditional storage of databases i.e. oracle, Sql server etc. Usually Big data includes structured, semi -structured and unstructured data.
![]()
Question 12.
How data is gathered in data acquisition stage?
Answer:
In data acquisition stage data is collected through online services, feedback, government portal and reviews of the customer.
Question 13.
What is done in data exploration stage?
Answer:
The collected data in data acquisition stage is analysed and then for better understanding the data is visualized with the help of some data visualizing tools. In order to get a clear picture of the trends from the available data sets.
Question 14.
How visualisation tolls helps in data exploration?
Answer:
Data visualisation tools help the designers to create visual representation of the data sets in an easy manner that then can be easily understood.
Question 15.
Depict the relation between AI, ML and DL.
Answer:
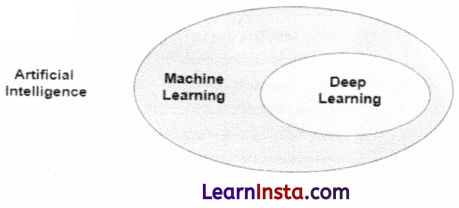
Artificial Intelligence is considered as the umbrella term, machine learning (ML) is the subset of Artificial Intelligence. Whereas Deep Learning (DL) is the subset of ML.
Question 16.
Write the names of any two decision-tree-related terms.
Answer:
Root Node and Branching
Question 17.
What are the Data visualisation tools?
Answer:
Data visualisation tools are Microsoft Excel, Tableau Public, Microsoft Power BI, Datawrapper, Google Data Studio.
Question 18.
What is data cleaning?
Answer:
The process of removing errors and inconsistencies from data.
Question 19.
What is a data breach?
Answer:
An incident where sensitive, protected or confidential data is accessed or disclosed without authorization.
![]()
Question 20.
What is a key benefit of data-driven decision making?
Answer:
Increased accuracy and efficiency in decision making.
Data Literacy Class 9 Short Answer Type Questions
Question 1.
What is Data visualization?
Answer:
The graphic depiction of data and information is known as data visualisation. It is simpler to comprehend the trends and patterns in data by using graphical tools like charts and graphs. Combining automated tools and manual techniques can be used to visualise data. It aids in organising your dispersed material into a well-defined, structured pattern.
Question 2.
Establish a distinction between training data and test data.
Answer:
| Training Data | Testing Data |
| It is data on which we train our AI project model. | It is used to check the performance of an AI model. |
| Example: Marks stored in a system. | Example: New marks entered and tested in a system |
Question 3.
A bar chart is what? and its applications.
Answer:
Rectangular bars with heights and lengths proportional to the values they represent are used in bar charts to visualise categorical data. Comparing items among several groups or tracking changes over time are both done with it.
Question 4.
Deep learning: What is it? Provide examples.
Answer:
Large amounts of datasets can be used by machines to make inferences that are useful. Deep learning involves training the computer with a tonne of data so that it can teach itself. Deep learning is a machine learning technique that draws inspiration from how our brain’s neurons function. Examples include picture recognition in social networking apps like Google Translate.
Question 5.
Name a few government websites from where you can get open-source data.
Answer:
data.gov: This is the official open data repository of the United States government, providing access to a wide range of datasets from various federal agencies.
Data.gov.uk: The UK government’s official data portal, offering access to open datasets across different sectors and regions of the United Kingdom.
European Data Portal: This portal provides access to open data from European Urrion institutions and member states, covering topics such as agriculture, economy, environment, and more.
Australian Government Data: The Australian government’s data portal, offering access to open datasets on topics such as demographics, health, education, and transportation.
Canada Open Data: The Canadian government’s open data portal, providing access to datasets from federal, provincial, territorial, and municipal governments across Canada.
India Open Data Portal: The Indian government’s official data portal, offering access to open datasets on various topics including demographics, agriculture, economy, and governance.
![]()
Question 6.
What is the features of Data?
Answer:
Data features are the characteristics or properties of the data. They describe each piece of information in a dataset. For example, in a table of student records, features could include things like the student’s name, age, or grade.
Data Literacy Class 9 Long Answer Type Questions
Question 1.
Individually describe each 4 Ws component.
Answer:
- Who: At this point, we search for the individuals experiencing the issue. They are the ones who the issue most immediately affects. They are sometimes referred to as the problem’s stakeholders.
- What: Here, we take into account the nature of the issue and how we can tell it’s a problem. Is there any proof that the issue exists or is it simply a perception?
- Where: We look at the problem’s context and the setting in which it occurs.
- Why: It implies to comprehend the underlying causes of the issue.
Question 2.
What is Data and types?
Answer:
Data is a piece of raw information or facts and statistics collected together for reference or analysis. They are raw facts that need to be processed to get meaningful information. There are two types of data i.e. Training data and Testing data.
Training Data- We use this information to train the AI project model. Basically, the goal is to make the project’s parameters suit the model. The output is available to the model in training data.
Testing Data: It is employed to evaluate an AI model’s effectiveness. When testing data, the data for which predictions must be made are not visible.
Question 3.
What is system maps and its uses.
Answer:
A system map is a diagram that shows how a group of related entities interact. It focuses on a system’s parts and boundaries. A system map enables us to discover connections between the various components of the problem that we have defined. Finding a solution aids in achieving our project’s objective. Below are the example to find the help.
If there are fewer cars on the road, it is safe for pedestrians to cross the street.
The amount of emissions likewise rises as the number of vehicles on the road does.

A system comprises of :
- Elements: These are different, discrete elements within the system.
- Interconnections: These are the relationships that connect the elements.
Question 4.
What is the importance of data visualization?
Data visualization is important for several reasons:
- Enhanced Understanding: Visual representations of data make complex information more understandable and accessible to a wide audience, aiding in comprehension and decision-making.
- Identification of Patterns and Trends: Data visualizations help identify patterns, trends, correlations, and outliers in data that may not be apparent in raw data tables, enabling deeper insights and analysis.
- Communication of Insights: Visualizations provide a clear and concise way to communicate findings, making it easier to convey complex information to stakeholders, clients, or the general public.
- Exploratory Data Analysis (EDA): Visualizations facilitate EDA by allowing analysts to interactively explore datasets, spot anomalies, and generate hypotheses for further investigation.
- Decision Support: Visual representations of data help stakeholders make informed decisions by presenting key information in a visually appealing and easily digestible format.
- Detecting Errors and Anomalies: Visualization tools can help identify data errors, inconsistencies, or anomalies that may require further investigation or cleaning.
- Monitoring Performance: Visual dashboards and real-time visualizations enable the monitoring of key performance metrics, facilitating timely interventions and adjustments.
- Enhanced Storytelling: Visualizations enhance storytelling by providing a compelling narrative backed by data, engaging audiences, and driving home key messages effectively.
Data Literacy Class 9 Case-Based Questions
Question 1.
Case 1: Retail Store Sales Analysis
Question:
A retail store noticed a decline in sales over the last quarter. They have collected data on monthly sales, customer footfall, and marketing expenses. The store manager wants to understand the factors contributing to the sales decline.
Answer:
To analyze the decline in sales, we should:
- Examine Trends: Analyze the monthly sales data to identify any specific month(s) where the decline started.
- Correlation Analysis: Check the correlation between sales and footfall. A high correlation might indicate that lower footfall is affecting sales.
- Marketing Impact: Assess the marketing expenses against safes data to see if marketing campaigns have been effective.
- Seasonal Patterns: Consider if there are any seasonal trends that might explain the sales fluctuations.
- External Factors: Investigate any external factors such as economic conditions, competitor actions, or market changes during the period.
![]()
Question 2.
Customer Feedback Analysis
Question:
An e-commerce company wants to improve customer satisfaction. They have collected customer feedback in the form of ratings (1 to 5 stars) and written reviews. How should they approach analyzing this data?
Answer:
To analyze customer feedback, we should:
- Rating Distribution: Plot the distribution of ratings to understand the overall satisfaction level.
- Sentiment Analysis: Perform sentiment analysis on the written reviews to categorize them as positive, neutral, or negative.
- Common Themes: Use text mining techniques to identify common themes and issues mentioned in the reviews.
- Correlation with Ratings: Examine the relationship between specific themes/issues and the ratings given.
- Actionable Insights: Identify key areas for improvement based on frequent negative feedback and praise areas to maintain based on positive feedback.
Question 3.
Employee Performance Evaluation
Question:
A company wants to evaluate the performance of its sales team. They have data on individual sales figures, the number of new clients acquired, and customer satisfaction scores. How should the company proceed with this evaluation?
Answer:
To evaluate the performance of the sales team:
- Sales Figures: Rank employees based on their total sales figures.
- Client Acquisition: Analyze the number of new clients acquired to understand the growth contribution by each employee.
- Customer Satisfaction: Include customer satisfaction scores to evaluate the quality of service provided.
- Weighted Scoring: Develop a weighted scoring system combining sales figures, new client acquisition, and customer satisfaction scores.
- Performance Distribution: Visualize the performance distribution to identify top performers, average performers, and those needing improvement.
Question 4.
Website Traffic Analysis
Question:
A blog website has experienced fluctuations in its traffic over the past six months. They have data on daily visits, page views, bounce rates, and sources of traffic. How can they analyze this data to understand the fluctuations?
Answer:
To analyze website traffic fluctuations:
- Traffic Trends: Plot daily visits and page views over the six months to identify any significant changes or patterns.
- Source Analysis: Break down traffic sources (organic search, direct, social media, referrals) to see if specific sources have contributed to fluctuations.
- Bounce Rates: Analyze bounce rates to assess visitor engagement and identify if high bounce rates coincide with traffic drops.
- Content Performance: Identify top-performing and underperforming content during periods of traffic changes.
- External Influences: Consider external factors such as search engine algorithm changes, seasonal trends, or marketing campaigns impacting traffic.
![]()
Question 5.
Manufacturing Process Improvement
Question:
A manufacturing company is experiencing variability in product quality. They have collected data on machine parameters, operator shifts, raw material batches, and defect rates. How should they analyze this data to improve product quality?
Answer:
To improve product quality, we should:
- Defect Rate Trends: Analyze defect rates over time to identify periods of high variability.
- Machine Parameters: Correlate machine parameters (e.g., temperature, pressure) with defect rates to identify any optimal ranges or problematic settings.
- Operator Analysis: Examine defect rates by operator shift to see if certain shifts correlate with higher defect rates.
- Raw Material Batches: Assess the quality of different raw material batches and their impact on defect rates.
- Multivariate Analysis: Use multivariate analysis to understand the combined effect of machine parameters, operator shifts, and raw materials on product quality.
Question 6.
The students of Class 9 in a school conducted a survey to understand the screen time habits of their peers. They designed a questionnaire asking about the average daily screen time for study, entertainment, and social media. They collected responses from 100 students and compiled the data into a spreadsheet. The students then used various data analysis techniques to interpret the data. They created graphs to visualize the screen time distribution and calculated averages, medians, and modes for each category. During the analysis, they discovered that a significant number of students spent more than four hours a day on screens, which raised concerns about potential negative impacts on health and academic performance.
Question.
What steps did the students follow to collect and organize the data on screen time habits?
Answer:
Steps Followed to Collect and Organize Data:
Designing the Questionnaire: Created questions about daily screen time for study, entertainment, and social media.
- Conducting the Survey: Collected responses from 100 students.
- Compiling Data: Entered the responses into a spreadsheet.
- Organizing Data: Structured the spreadsheet to categorize data for analysis.
Question.
What types of data visualization tools did the students use, and how did these tools help in interpreting the data?
Answer:
Data Visualization Tools Used:
- Graphs and Charts: Bar graphs, pie charts, and line graphs to visualize the distribution of screen time across different activities.
- Histograms: To show the frequency of different screen time ranges.
- Scatter Plots: To identify any correlations between different types of screen time.
These tools helped the students by providing a clear visual representation of the data, making it easier to identify patterns and trends.
Question.
Explain the significance of calculating averages, medians, and modes in data analysis.
Answer:
Significance of Averages, Medians, and Modes:
- Average (Mean): Provides a central value for the dataset, indicating the overall screen time tendency.
- Median: Represents the middle value, giving an idea of the typical screen time without being skewed by extreme values.
- Mode: Shows the most frequently occurring screen time, highlighting common habits.
![]()
Question.
What conclusions did the students draw from their analysis of screen time habits?
Answer:
Conclusions Drawn:
- A significant number of students spent more than four hours daily on screens.
- Screen time was predominantly used for entertainment and social media rather than study.
- Potential negative impacts on health (e.g., eye strain, poor posture) and academic performance were identified.
Question.
How can data literacy help students make informed decisions about their screen time?
Answer:
Role of Data Literacy in Informed Decision-Making:
- Helps students understand and interpret data accurately.
- Empowers them to identify and address issues, such as excessive screen time.
- Enables them to make evidence-based decisions to balance screen use and adopt healthier habits.
Data Literacy Class 9 Notes
1. Data literacy-Data literacy is the ability to understand, interpret, and communicate with data effectively. It involves skills such as data analysis, visualization, and interpretation, enabling individuals to make informed decisions and derive insights from data.

2. How to become Data Literate- Every data tells a story and Data literate is a person who can interact with data to understand the world around them.
3. Data Privacy-Data privacy referred to as information privacy is concerned with the proper handling of sensitive data including personal data and other confidential data.
4. Data Security-Data security is the practice of protecting digital information from unauthorized access, corruption, or theft throughout its entire lifecycle.
5. Types of Data:

6. Data processing- After raw data is collected, data is processed to derive meaningful information from it.
7. Data analysis- Data analysis is to examine each component of the data in order to draw conclusions.
8. Data interpretation-It is to be able to explain what these findings/conclusions mean in a given context.
9. Data Presentation-In this step, you select, organize, and group ideas and evidence in a logical way.

10. Different approaches of AI modelling-Broadly AI modelling is based on two approaches, they are as follows.

11. Model Evaluation-This is the last stage of the AI project cycle. In this stage model is evaluated against different parameters and its efficiency is calculated. Further in this stage model deployment is also done.