Students often refer to Maths Mela Class 4 Solutions Chapter 14 Data Handling Question Answer NCERT Solutions to verify their answers.
Class 4 Maths Chapter 14 Data Handling Question Answer Solutions
Data Handling Class 4 Maths Solutions
Class 4 Maths Chapter 14 Solutions

Look at the questions asked by Rohan and Anjali.
Tick the question that is the most appropriate for finding the ‘most liked subject’? Why do you think so? Discuss with your friends and teacher.

Answer :
Anjali’s way of asking questions is the most appropriate for finding the ‘most liked subject’ because her question is clear and students only share their most liked subject.
NCERT Textbook (Page 204)
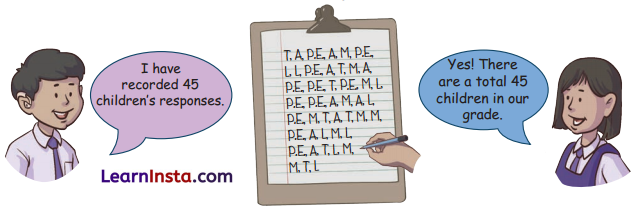
Look at the children’s responses above and answer the following questions:
Answer :
- The number of children who like Mathematics the most is 10.
- The number of children who like Language the most is 8.
- The number of children who like The World Around Us the most is 7.
- The number of children who like Physical Education the most is 11.
- The number of children who like Arts the most is 9.
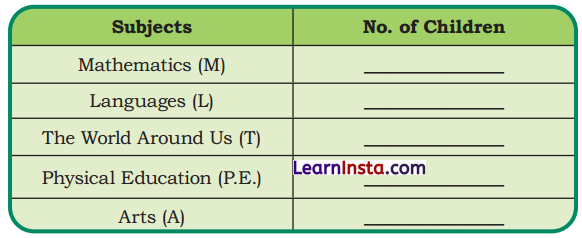
Let’s fill the above information in this table.
Answer :
| Subjects | No. of Children |
| Mathematics (M) | 10 |
| Languages (L) | 8 |
| The World Around Us (T) | 7 |
| Physical Education (P.E.) | 11 |
| Arts (A) | 9 |
Now look at the above table and answer the following questions:
What is the most common favourite subject among the children?
Answer :
The most common favourite subject among the children is Physical Education.
![]()
What is the least common favourite subject among the children?
Answer :
The least common favourite subject among the children is The World Around us.
There are the following two ways to display the information.

Which way of displaying information is easier to understand and why?
Answer :
Option 2 for displaying information is easier to understand.
Colourful Golas (Pages 206-207)
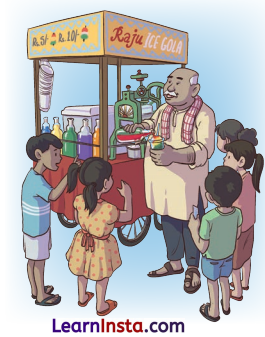
During school lunch break children rush to eat gola of their favourite colour.
Rohan and Anjali record the golas eaten by different children. They want to eat the one that is most eaten by others.
They both start recording the golas eaten by the children.

Look at the information given above. Colour the line drawing of the golas appropriately.
Question 1.
Which colour ice gola do the children eat:
(a) the most
(b) the least
How do you know?
Answer :
(a) Yellow colour
(b) Blue colour
Because the yellow colour gola appears the most and the blue colour gola appears the least numbers of times.
![]()
Question 2.
Which colour gola would Anjali and Rohan have bought?
Answer :
Yellow colour
Question 3.
Which colour golas did boys eat the most?
Answer :
Yellow colour (Answer : may be different)
Question 4.
Which colour golas did girls eat the most?
Answer :
Red colour (Answer : may be different)
Question 5.
Which of the ways of representing data did you use to answer these questions and why?
Answer :
To make sense of the gathered information it has been organized and put into tables.
Such an arrangement is called pictograph. But it is possible only when the number for each category is not very large.
Activity-Chess or Cricket (Page 207)
Find out from your classmates how many of them play only chess, only cricket, both or neither.

Now let us organise the above data in the table.
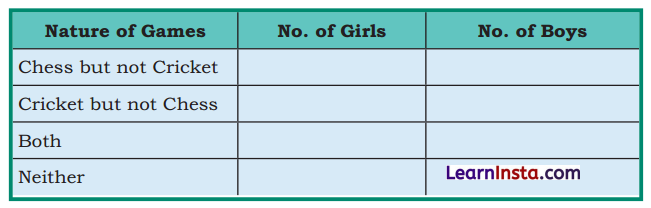
Answer these questions based on the data collected from your grade
1. Who plays Chess the most? _______ (Boys/Girls)
2. Who plays Cricket the most? _______ (Boys/Girls)
3. How many children play both types of games? _______
Answer :
Do yourself.
Bal Mela (Page 208)

Anjali and Rohan have recorded the number of people who ate fruit chaats and sandwiches in the Bal Mela over three days, using a Pictograph.

Let Us Do (Page 208)
Question 1.
Complete the table.

Answer :
| Items | Total Sold Items |
| Fruit Chaats | 28 |
| Sandwiches | 46 |
Question 2.
On which day were the most sandwiches sold?
Answer :
Day 3.
![]()
Question 3.
Which item had the highest sale on Day 2?
Answer :
Sandwiches.
Question 4.
Complete the table given below. Circle the day that had the highest sales.

Answer :
