MCQ on Data Handling and Presentation Class 6
Class 6 Maths Chapter 4 MCQ Data Handling and Presentation
Multiple Choice Questions
Question 1.
The data represented in the form of pictures are called
(a) Pictograph
(b) Bar graph
(c) Frequency table
(d) None of these
Answer:
(a) Pictograph
Question 2.
The bars used to count frequencies are called:
(a) bars
(b) tally marks
(c) range
(d) none of these
Answer:
(b) tally marks
![]()
Question 3.
A collection of numbers collected to give some information is called:
(a) frequency
(b) range
(c) data
(d) values
Answer:
(c) data
Question 4.
Representation of data using rectangles of uniform width and equal spacing between them is called:
(a) pictograph
(b) bar graph
(c) tabular form
(d) none of these
Answer:
(b) bar graph
Question 5.
Data collected directly from the source is called:
(a) observation
(b) frequencies
(c) primary data
(d) secondary data
Answer:
(c) primary data
Question 6.
A ________ of information in the form of numerical figures is called data.
Answer:
Collection
Question 7.
The shape of bar graph is ________.
Answer:
Rectangle
Question 8.
A is a way to represent data using images.
Answer:
Pictograph
Question 9.
An observation occurring eight times in a data is recorded as |||||||| using tally marks. Write the correct tally marks. (Easy)
Answer:
Using tally marks, the occurrence of any observation eight times can be represented as
![]()
Question 10.
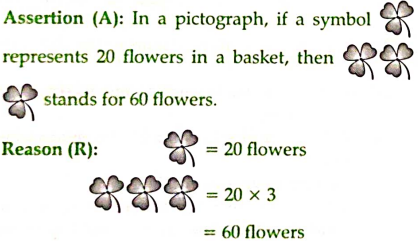
(a) ‘A’ is true and ‘R’ is the correct explanation of ‘A’.
(b) ‘A’ is true but ‘R’ is not the correct explanation of ‘A’.
(c) Both’A’ and ‘R’ are true.
(d) Both ‘A’ and ‘R’ are false.
Answer:
Option (a) is correct.
Explanation:
The pictograph represents the correct number of flowers.
So, assertion is correct and reason is correct explanation for assertion.
Question 11.
Assertion (A):
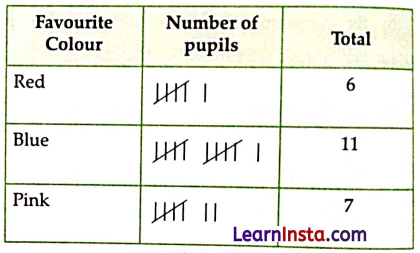
Reason (R): The | mark is called a tally mark. Four vertical lines drawn and crossed by a slanting line makes a group of five. We use tally mark to organise a data.
(a) ‘A’ is true and ‘R’ is the correct explanation of ‘A’.
(b) ‘A’ is true but ‘R’ is not the correct explanation of ‘A’.
(c) Both’A’ and ‘R’ are true.
(d) Both ‘A’ and ‘R’ are false.
Answer:
Option (a) is correct
Explanation:
Raw data is organised by usine tally marks.
Complete the table.
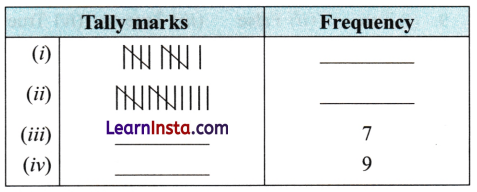
Answer:
(i) 11
(ii) 14
(iii) ![]()
(iv) ![]()
Fill in the blanks:
(i) If the symbol ![]() represents 10 students and the symbol
represents 10 students and the symbol ![]() represents 5 students, then
represents 5 students, then
(a) ![]() will represent ___________ students.
will represent ___________ students.
(b) ![]() will represent ___________ students.
will represent ___________ students.
(c) ![]() will represent ___________ students.
will represent ___________ students.
(d) ![]() will represent ___________ students.
will represent ___________ students.
Answer:
(a) 20
(b) 35
(c) 25
(d) 30
![]()
(ii) Fill in the blanks:
If ![]() = 5,
= 5, ![]() = 4,
= 4, ![]() = 3,
= 3, ![]() = 2 and
= 2 and ![]() = 1, then
= 1, then
(a) ![]() = ___________
= ___________
(b) ![]() = ___________
= ___________
(c) ![]() = ___________
= ___________
(d) ![]() = ___________
= ___________
Answer:
(a) 15
(b) 14
(c) 16
(d) 18
Tick the correct option:
(i) In a bar graph, the [length/width] of each bar represents the given information.
Answer:
length
(ii) A [bar graph/pictograph] represents the data in the form of pictures.
Answer:
pictograph
(iii) If the data is collected directly from the source, it is called [primary data/secondary data]
Answer:
primary data
Write True or False:
(i) The purpose behind collecting data is for giving information and for making conclusions.
Answer:
True
(ii) The width of bars and spacing between them in a bar graph have significance.
Answer:
False
(iii) The height of a bar in a bar graph is the most significant because the height of the bar is directly proportional to the value of corresponding data.
Answer:
True
(iv) A bar graph is a better method to represent data as compared to pictograph.
Answer:
True
(v) For recording and organising of data tally marks are used to show frequency.
Answer:
True
![]()
Match the following:
| Column A | Column B |
| (a) Representation of data using rectangles of uniform width and equal spacing between them. | (i) Tally Marks |
| (b) Bars used to count frequencies | (ii) Secondary Data |
| (c) Data represented in the form of pictures. | (iii) Bar Graph |
| (d) Data collected from newspaper | (iv) Pictograph |
Answer:
| Column A | Column B |
| (a) Representation of data using rectangles of uniform width and equal spacing between them. | (iii) Bar Graph |
| (b) Bars used to count frequencies | (i) Tally Marks |
| (c) Data represented in the form of pictures. | (iv) Pictograph |
| (d) Data collected from newspaper | (ii) Secondary Data |
Fun Activity
Question 1.
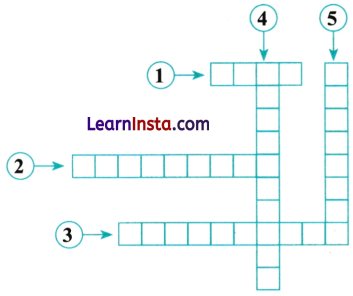
Complete the crossword puzzle using the given directions:
Directions:
Across:
(1) The numerical information is called ____________
(2) The number of data in a group is called ____________
(3) ____________ is the way of representing data using images of objects.
Down:
(4) ____________ are usually used to record and organise the data.
(5) A ____________ is a representation of data by rectangular bars of uniform width.
Answer:
Across:
(1) Data
(2) Frequency
(3) Pictograph
Down:
(4) Tally Marks
(5) Bar Graph
Answer the following.
Question 1.
Home appliances sold by a shop in a week are given below:
| Home Appliances | No. of Items |
| Refrigerator | 10 |
| Television | 8 |
| Washing Machine | 7 |
| Air Conditioner | 12 |
| Microwave | 6 |
| Mixer | 9 |
Draw a suitable graph to represent the given data.
(a) Which appliance was sold maximum in number?
Answer:
Air Conditioner
(b) How many appliances were sold in all during the week?
Answer:
52
Question 2.
The following is the number of LED bulbs manufactured (in thousands) by a factory during the first six months of 2024.
| Months | January | February | March | April | May | June |
| Number of LED Bulbs | 24 | 32 | 28 | 36 | 40 | 48 |
Draw a pictograph for the given data.
![]()
Question 3.
The shoe size of 40 people is given below:
6, 8, 5, 8, 7, 6, 8, 9, 8, 6, 7, 5, 7, 7, 8, 8, 5, 8, 6, 6, 6, 7, 5, 8, 7, 6, 9, 7, 7, 5, 6, 6, 6, 9, 7, 7, 7, 6, 5, 7
Represent the data in a frequency distribution table. Also, answer the following questions.
(i) What is the size of shoes worn by the maximum number of people?
Answer:
7
(ii) What is the size of shoes worn by the minimum number of people?
Answer:
9
Question 4.
The table shows the rainfall for the 6 months. Draw a bar graph to show the following data:
| Month | Rainfall (in cm) |
| January | 7 |
| February | 4 |
| March | 12 |
| June | 25 |
| July | 21 |
| August | 19 |