Students can access the CBSE Sample Papers for Class 11 Economics with Solutions and marking scheme Set 3 will help students in understanding the difficulty level of the exam.
CBSE Sample Papers for Class 11 Economics Set 3 with Solutions
Time : 3 Hours
Maximum Marks : 80
General Instructions:
- 1. This question paper contains two sections:
Section A – Statistics for Economics Section B – Introductory Micro Economics - This paper contains 20 Multiple Choice Questions type questions of 1 mark each.
- This paper contains 4 Short Answer Questions type questions of 3 marks each to be answered in 60 to 80 words.
- This paper contains 6 Short Answer Questions type questions of 4 marks each to be answered in 80 to 100 words.
- This paper contains 4 Long Answer Questions type questions of 6 marks each to be answered in 100 to 150 words.
Section – A
Question 1.
Read the following Statements and choose the correct alternative: [1]
Statement – I: Macro and micro are the branches of economic studies.
Statement – II: Macro deals with individual economic issues Alternatives:
(A) Statement 1 is true and Statement 2 is false.
(B) Statement 1 is false and Statement 2 is true.
(C) Both Statements 1 and 2 are true.
(D) Both Statements 1 and 2 are false.
Answer:
Option (A) is correct
Explanation: Microeconomics deals with individual economic issues while macroeconomics deals with economy as a whole.
Question 2.
Which of the following statements is false: [1]
(A) Statistics deals with only quantitative data
(B) Statistics solves economic problems
(C) Statistics deals with qualitative data
(D) Statistics does not study individual units.
Answer:
Option (C) is correct
Explanation: Statistics cannot deal with qualitative data as they cannot be expressed in terms of numbers or cannot be quantified.
Question 3.
There are ………………. degrees in a complete pie chart. [1]
(A) 250
(B) 280
(C) 360
(D) 180
Answer:
Option (C) is correct
Explanation: A Pie Chart is a full circle so it has 360°.
Question 4.
Identify the correct pair of terms and definitions from the following Columns I and II: [1]
| Column I | Column II |
| A. Good questionnaire | 1. Minimum and concise questions |
| B. NSSO | 2. National Service Survey Organisation |
| C. Primary data | 3. Government publications |
| D. Sample Investigation | 4. Each and every unit of universe is studied |
(A) A – 1
(B) B – 2
(C) C – 3
(D) D – 4
Answer:
Option (A) is correct
Explanation: A good questionnaire should be valid, reliable, clear, succinct and interesting and should have minimum and concise questions.
Question 5.
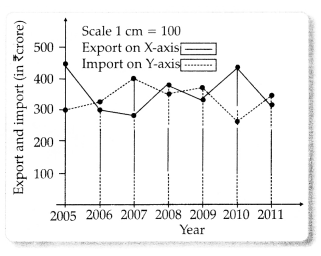
Identify the following diagram and choose the correct alternative. [1]
(A) Time series graph
(B) Frequency polygon
(C) Ogive
(D) Histogram
Answer:
Option (A) is correct
Explanation: The given diagram show the annual profit figures of a firm with the help of a time series graph.
Question 6.
Mean should be [1]
(A) Simple
(B) Based on all the values
(C) Clearly defined
(D) All of the these.
Answer:
Option (D) is correct
Explanation: Mean should be simple, based on all observations and clearly defined.
Question 7.
What should be taken into consideration in the graphical presentation of statistical data? [1]
(A) Appropriate title
(B) Scale
(C) False base line
(D) All of the these
Answer:
Option (D) is correct
Explanation: Appropriate title, scale and false base line, all these should be taken into consideration in the graphical presentation of statistical data.
Question 8.
Which of the following is incorrect regarding mode? Choose the correct alternatives. [1]
I. Affected by the extreme values.
II. It is positional average.
III. Mode is used for determination of model output, sales.
IV. Mode = 3M – 2 X
Alternatives:-
(A) I and II
(B) II and III
(C) I, II and III
(D) I, III and IV
Answer:
Option (A) is correct
Explanation: Mode is not affected by extreme values and it is the value with the highest frequency.
Question 9.
Read the following Assertion (A) and Reason (R) and choose the correct alternative: [1]
Assertion (A): Less than or more than ogive can be used to calculate correlation.
Reason (R): When changes in two related variables are in the same ratio, then it is a case of perfect correlation.
Alternatives:
(A) Both Assertion (A) and Reason (R) are true, and Reason (R) is the correct explanation of Assertion (A).
(B) Both Assertion (A) and Reason (R) are true, but Reason (R) is not the correct explanation of Assertion (A).
(C) Assertion (A) is true, but Reason (R) is false.
(D) Assertion (A) is false, but Reason (R) is true.
Answer:
Option (D) is correct
Explanation: Less than or more than give can be used to calculate median value.
Question 10.
What is the main purpose of index number? [1]
(A) To measure change
(B) To measure deviation
(C) To measure the relation
(D) None of the these
Answer:
Option (A) is correct.
Explanation: Index numbers are intended to measure the degree of economic changes over time. These numbers are values stated as a percentage of a single base figure. Index numbers are important in economic statistics. In simple terms, an index (or index number) is a number displaying the level of a variable relative to its level (set equal to 100) in a given base period.
Question 11.
“Confidential information can be collected through Indirect Oral Investigation only” [3]
Do you agree with the given statement? Give valid reason in support of your answer.
Answer:
Yes, I agree. In Indirect Oral Investigation, data is collected through indirect sources. Persons, who are likely to have information about the problems, are interrogated and on the basis of their answers, factual data have to be compiled. Most of the commissions of enquiry appointed by government collect primary data by this method. The accuracy of the method depends largely upon the type of persons interviewed and hence these persons have to be selected very carefully.
Question 12.
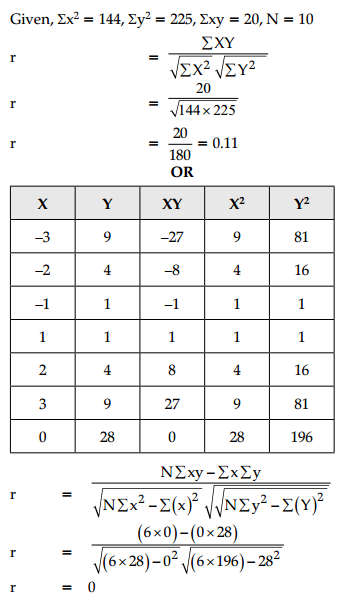
Compute Coefficient of Correlation from the following data:
| X-series | Y-series | |
| Mean | 15 | 28 |
| Sum of Squares of Deviation from Mean | 144 | 225 |
Sum of products of deviation of X and Y-series from their respective mean is 20. Number of pairs of observations is 10. [3]
OR
Calculate the Correlation coefficient between X and Y and comment on their relationship:

Answer:
Question 13.
In a trip organised by a college, there were 80 people, each of whom paid ₹15.50 on an average. There were 60
students, each of whom paid ₹16. Members of teaching staff were charged at a higher rate. The number of servants (all males) was six and they were not charged anything. The number of ladies was 20% of the total and there was only one lady staff member. Prepare the tabular information. [4]
Answer:
First of all the data should be divided into various classes such as students, teaching staff and servants and after that total contribution should be calculated.:

Question 14.
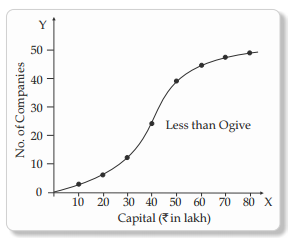
(a) From the following frequency distribution, prepare the less than ogive: [4]
| Capital (₹ in lakh) | Number of Companies |
| 0 – 10 | 2 |
| 10 – 20 | 3 |
| 20 – 30 | 7 |
| 30 – 40 | 11 |
| 40 – 50 | 15 |
| 50 – 60 | 7 |
| 60 – 70 | 2 |
| 70 – 80 | 3 |
OR
(b) Locate the Mode graphically
| Marks | No. of students |
| 0 – 10 | 5 |
| 10 – 20 | 10 |
| 20 – 30 | 20 |
| 30 – 40 | 25 |
| 40 – 50 | 20 |
| 50 – 60 | 10 |
| 60 – 70 | 5 |
Answer:
As per the question, data of capital and number of companies are given. For less than ogive, we will have to prepare cumulative frequency distribution.
The less than ogive of given frequency distribution is shown below:
| Capital (₹) in lakhs) | Number of Companies |
| below 10 | 2 |
| below 20 | 5 |
| below 30 | 12 |
| below 40 | 23 |
| below 50 | 38 |
| below 60 | 45 |
| below 70 | 47 |
| below 80 | 50 |
OR
(b) Firstly, we draw the histogram of the given data Here, maximum height of rectangle is 25.00 modal class is 30 – 40.
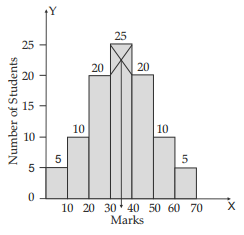
It is clear from the histogram that the value of mode.
Question 15.
Calculate mode from the following data: [4]
| Size | Frequency |
| 0 – 5 | 3 |
| 5 – 10 | 9 |
| 10 – 15 | 15 |
| 15 – 20 | 23 |
| 20 – 25 | 30 |
| 25 – 30 | 20 |
Answer:
| Size | Frequency | CF |
| 0 – 5 | 3 | 3 |
| 5 – 10 | 9 | 12 |
| 10 – 15 | 15 | 27 |
| 15 – 20 | 23 | 50 |
| 20 – 25 | 30 | 80 |
| 25 – 30 | 20 | 100 |
Mode Value (Z) = L1 + \(\frac{f_1-f_0}{2 f_1-f_0-f_2}\)
The class 20 – 25 is having highest frequency
20 + \(\frac{30-23}{2 \times 30-23-20}\)
= 20 + \(\frac{7}{60-43}\)
= 20 + \(\frac{7}{17}\)
= 20 + 0.41
= 20.41
Question 16.
(a) Five students have been assigned ranks on the basis of their ability: [3]

Calculate Rank Correlation Coefficient.
(b) Define Mode and write its three demerits. [3]
OR
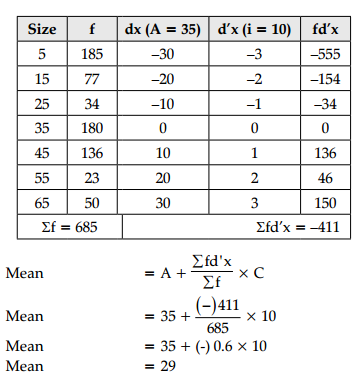
(a) Calculate Mean from the following data:
| Size | Frequency |
| 5 | 185 |
| 15 | 77 |
| 25 | 34 |
| 35 | 180 |
| 45 | 136 |
| 55 | 23 |
| 65 | 50 |
(b) Mode is the best representative value of all items of the series because it is that value which occurs most frequently in the series. State three advantages of Mode in the context of above statement.
Answer:
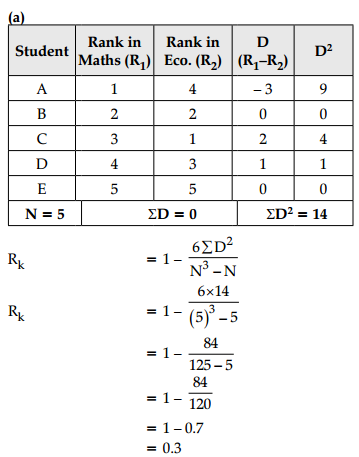
(b) Mode: “The value occurring most frequently in series (or group) of items and around which the other items are distributed most densely”.
Demerits of the Mode:
- Incapable of Algebraic treatment: Unlike mean, mode is not capable of further algebraic treatment.
- Uncertain and vague: Mode is an uncertain and vague measure of central tendency.
- Restricted use: If the frequency of each item of the series is same than mode cannot be calculated. In this way, the use of mode is restricted.
OR
(a)
(b) Mode is the best representative value of all items of the series because:
- It is easy to calculate and can be easily understood. It can be located by inspection only.
- It is not affected by the extreme values in a series
- It can be calculated even in case of open- end classes.
- Mode helps in describing the qualitative aspects of phenomenon. (Any three)
Question 17.
(a) What is an Activity? Explain Economic Activities and Non-Economic Activities with examples. [3]
(b) With the help of suitable example, explain the problem of ‘for whom to produce’? [3]
Answer:
An Activity refers to a kind of work in which people are engaged in their day-to-day life that can be either economic activity or non-economic activity.
(i) Economic Activities: People are engaged in different type of activities, such as a doctor, teacher, lawyer, businessman or industrialist, etc. Everyone is busy in one or another kind of work to earn money or wealth to satisfy their needs. Therefore, in simple terms, an activity which is related to the use of limited resources is called an economic activity. For example, establishing a dairy for producing milk products for consumers which turns to be a method of earning wealth. Further, economic activities are categorized in different ways which are as under:
(A) Production,
(B) Consumption,
(C) Investment,
(D) Exchange,
(E) Distribution.
(ii) Non-economic Activities: Those activities which are not concerned with earning money or wealth are called Non-economic Activities. These are social activities, religious activities, ethical activities, charitable activities and parental activities. The objective of these kind of activities is not to earn money.
(b) The ‘for whom to produce’ problem is concerned with the distribution of income in an economy. It is concerned with whether to produce goods for high income groups or low income groups. For example : If an economy produces goods for those who can pay high price, then it will end up in producing only those goods and services which a richer section of the society can easily afford, such as expensive jewellery, luxurious cars, etc. Their standard of living will improve but that of the poor would decline. As a result, the gap between the rich and the poor would keep on widening. On the other hand, if the economy produces goods only for low income groups, such as wheat, rice, etc, then they may not be able to afford it which will reduce the profits of the producers. Consequently, output level may fall short.
Section – B
Question 18.
Identify the correct pair of items from the following Columns I and II [1]
| Column I | Column II |
| A. Utility | 1. Bread and butter |
| B. Normal Goods | 2. Rise in price |
| C. Contraction in demand | 3. Capacity of a commodity to satisfy human wants |
| D. Complementary goods | 4. Positively |
Alternatives
(A) A – 1
(B) B – 2
(C) C – 3
(D) D – 4
Answer:
Option (D) is correct.
Explanation: Complementary goods are paired goods which are positively related with each other. Rise in demand for goods also increases the demand for its paired goods.
Question 19.
According to the Law of Diminishing Marginal Utility, satisfaction obtained from consumption of each successive unit [1]
(A) Increases
(B) Decreases
(C) Remains same
(D) Either increases or decreases
Answer:
Option (B) is correct.
Explanation: Law of Diminishing Marginal Utility states the as we consume more unit of commodity, the satisfaction obtained from consumption of each successive unit decreases.
Question 20.
Which of the following influences price elasticity of demand: [1]
(A) Nature of the commodity
(B) Income level
(C) Availability of substitutes
(D) All the above
Answer:
Option (D) is correct.
Explanation: Income of consumer, substitute goods and nature of goods, all of these brings effect on price elasticity of demand directly.
Question 21.
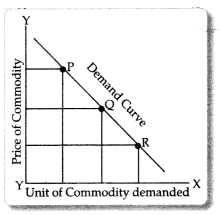
Price elasticity of demand for good X is given below. Identify the degree of elasticity? [1]
(A) Ed = 0
(B) Ed = 1
(C) Ed < 1
(D) Ed > 1
Answer:
Option (B) is correct.
Explanation: The given curve shows unit elasticity of demand for commodity X. Percentage change in quantity demanded is equal to percentage change in price. Thus, the degree of elasticity is Ed = 1.
Question 22.
Read the statements Assertion (A) and Reason (R) and choose the correct alternative: [1]
Assertion (A): Demand for refrigerator is unitary elastic.
Reason (R): The unitary elastic demand have elasticity equal to one.
Alternatives:
(A) Both Assertion (A) and Reason (R) are correct, and Reason (R) is the correct explanation of Assertion (A).
(B) Both Assertion (A) and Reason (R) are correct, but Reason (R) is not the correct explanation of Assertion (A).
(C) Assertion (A) is true but Reason (R) is false.
(D) Assertion (A) is false but Reason (R) is true.
Answer:
Option (D) is correct.
Explanation: Demand for refrigerators is relatively elastic as the fall in price will lead to a lot increase in the quantity demanded.
Question 23.
Which of the following is the reason for leftward shift of demand curve: [1]
(A) Rise in the price of the commodity
(B) Fall in the price of the commodity
(C) Fall in the price of substitutes
(D) Fall in the price of complements
Answer:
Option (D) is correct.
Explanation: When the prices of the complements fall the goods become relatively cheaper and thus, at the same price level more quantity will be demanded.
Question 24.
“The minimum wage of an industrial labour in India should be raised by 20%”. [1]
The above statement is associated with
Alternatives:
(A) Normative Economics
(B) Positive Economics
(C) Both Normative and Positive
(D) None of these
Answer:
Option (A) is correct.
Explanation: Given statement is an example of normative economics. It examines real economic events and it passes value judgment regarding what is right or wrong.
Question 25.
In perfectly elastic supply ………………. is not responsive to the change in …………….. . [1]
(A) Supply, price
(B) Price, supply
(C) Price, cost
(D) Cost, Price
Answer:
Option (B) is correct.
Explanation: In perfectly elastic supply price is not responsive to the change in supply.
Question 26.
There are two statements given below, marked as Statement (I) and Statement (II). Read the statements and choose the correct option: [1]
Statement -I: Production function is the functional relation between output and input.
Statement – II: In short run, output is the result of variable factors of production.
Alternatives:
(A) Statement I is true and Statement II is false.
(B) Statement I is false and Statement II is true.
(C) Both statements I and II are true
(D) Both statements I and II are false
Answer:
Option (A) is correct.
Explanation: In short run production function, both variable (L) and fixed (K) factors of production determine the output. That’s why production function expresses the functional relation between both type of input and output.
Question 27.
We can get …………….. through TCn – TCn – 1[1]
(A) MC
(B) ATC
(C) MP
(D) TVC
Answer:
Option (A) is correct.
Explanation: Marginal cost is the change in TC that comes from making or producing one additional unit of output. We can get MC through TCn – TCn – 1.
Question 28.
Explain the chain effects, if the prevailing market price is below the equilibrium price. [3]
OR
Answer the following questions:
(i) Why can a firm not earn abnormal profits under perfect competition in the long run? Explain.
(ii) Under which market form a firm is called a ‘price taker’ and why?
Answer:
When market price is less than the equilibrium price excess demand is created, i.e., quantity demanded is more than the quantity supplied at the prevailing market price. If the prevailing market price, say OP1 is less than equilibrium price OP, then market demand of OP2 will be greater than market supply of OP2.
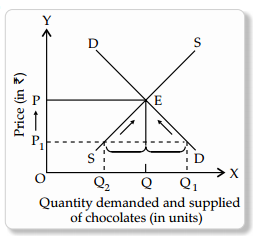
- The excess demand of Q1Q2 results in competition amongst the buyers as each buyer wants to have the commodity. It leads to increase in market price.
- Increase in price results in contraction along the demand curve and expansion along the supply curve.
- The market price will continue to rise till excess demand is wiped out.
Conclusion: Eventually price will increase to a level where market demand is equal to market supply at OQ and equilibrium price of OP will be attained.
OR
(i) Under perfect competition, there is freedom of entry to firms into industry. When there are abnormal profits, new firms will enter. This will increase supply and price will fall. This process will continue till abnormal profits are wiped out.
(ii) A firm is said to be a price taker when it has no option but to accept the market determined price. It happens in a perfectly competitive market. The price in the market is determined by the industry and no individual firm has significant share in the market as to influence the price.
Question 29.
“Under perfect competition, the seller is price taker, under monopoly he is the price maker.” Justify the above statements. [3]
Answer:
Under perfect competition, the price is determined by the industry. It is due to the fact that there are large number of buyers and sellers of homogeneous products under perfect competition. No single seller by changing his supply can influence the price. A monopolist is the only seller and himself determines price of his product. He is a price maker. There is no challenge to his pricing decisions as there are no competitive firms in the market and there are no close substitutes of his product. Barriers to the entry of new firms further strengthen his position as a price maker.
Question 30.
As a result of 20% rise in price of commodity X, its demand falls from 200 units to 190 units. Calculate its price elasticity of demand. [4]
Answer:
% Change in quantity demanded
\(\frac{500-400}{400}>\) × 100
25%
Elasticity of demand = \(\frac{\text { \%Change in Q.D }}{\text { \%Change in Price }}\)
= \(\frac{25}{20}\)
= 1.25
Greater than unit elasticity
Question 31.
Cakulate Marginal Cost at each level of output: [4]
| Output (Units) | Average Variable Cost (₹) |
| 1 | 26 |
| 2 | 22 |
| 3 | 20 |
| 4 | 20 |
| 5 | 22 |
| 6 | 24 |
OR
Explain the distinction between “Movement along the supply curve” and “shift of supply curve”.
Answer:
| Output (Units) | Average Variable Cost (₹) | TVC | MC = \(\frac{\Delta T V C}{\Delta Q}\) |
| 1 | 26 | 26 | 26 |
| 2 | 22 | 44 | 18 |
| 3 | 20 | 60 | 16 |
| 4 | 20 | 80 | 20 |
| 5 | 22 | 110 | 30 |
| 6 | 24 | 144 | 34 |
OR
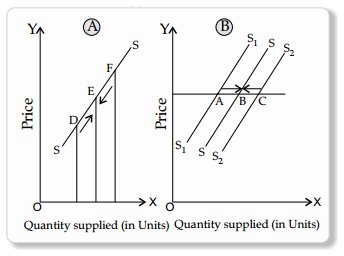
Change in Quantity Supplied: It refers to the change in supply due to own price of the goods only. (Refer fig. A). It means movement along the same supply curve. It is called extension when supply rises from D to E and contraction when supply falls (from F to E).
Change in Supply: It refers to change in supply due to factor other than the own price of the goods like change in prices of inputs, etc., (Refer fig. B). This leads to shift of supply curve. It is called increase in supply, when supply rises (from A to B) and decreases when supply falls from (C to B).
Question 32.
Observe the given diagram and answer the question: [4]
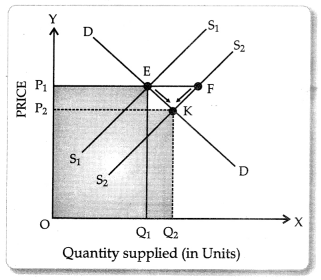
Explain the effects of rightward shift of supply curve of a commodity on its price and quantity demanded and supplied.
Answer:
Market equilibrium is a situation where market demand is equal to market supply. Effect of increase in supply of a good on equilibrium price and equilibrium quantity is discussed in given figure. In given diagram, S1S1 is the initial supply curve crossing demand curve DD at point E, which is the point of initial equilibrium. Now, owing to an increase in supply, supply curve shifts to the right, from S1S1 to S2S2. As an immediate impact of increase in supply, there is excess supply, equal to EF (at the existing price).
Due to the excess supply (and sluggish demand), price of the commodity tends to be lower than the equilibrium price. At lower price, quantity demanded tends to extend. Extension of demand occurs from point E towards point K. However, at lower price, quantity supplied tends to contract. The contraction of supply occurs from point F towards point K. The process of extension of demand and contraction of supply (triggered by the lowering price) continues till the excess supply is fully exhausted. K is the point of new equilibrium where the market clears itself once again. Corresponding to the new equilibrium, quantity demanded is equal to the quantity supplied, i.e., OQ2 and equilibrium price is OP2.
Thus, the net effect of increase in supply is :
- Equilibrium price reduces from OP1 to OP2, and
- Equilibrium quantity rises from OQ1 to OQ2.
Question 33.
(a) Discuss the relationship between Average Product and Marginal Product with the help of a diagram. [3]
(b) What causes increasing returns to a factor? [3]
OR
(a) ‘If more variable factors are employed with fixed factors, the Total Product increases at an increasing rate and finally it falls.’ Explain the three stages of the law, with the help of TP, AP and MP curves.
(b) State the behaviour of Marginal Physical Product under Returns to a Factor.
Answer:
(a) The relationship between AP and MP can be explained with the help of the following diagram:
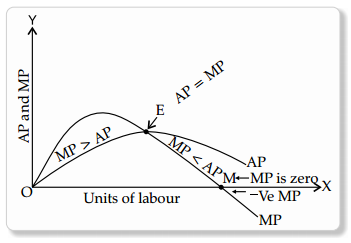
In the diagram:
- AP increases when MP is greater than AP.
- AP is at its maximum when both MP and AP are equal. This is shown at point E.
- AP decreases when MP in less than AP.
- MP can be positive, zero or negative, but AP is always positive.
(b) Increasing returns occur owing to following reasons:
- Greater application of the variable factor ensures fully utilisation of the fixed factor.
- Greater application of the variable factor facilitates better division of labour.
- Greater application of the variable factor improves co-ordination between the factors.
OR
(a) Law of Variable Proportion states that as more and more of the variable factor is combined with the fixed factor, marginal product (MP) of the variable factor may initially increase and subsequently stabilise but must finally decrease. Phase of changes in Total Product according to the Law of Variable Proportion are shown in following figure:
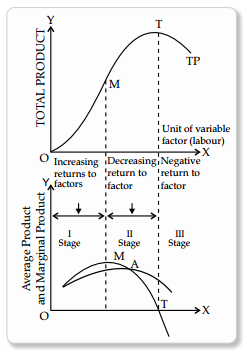
(i) Phase I-Increasing Returns: This stage is in between O to M on TP curve. In this stage, MP tends to rise till OM units of labour are used with the constant application of fixed factor. When MP is rising, TP tends to rise at an increasing rate. This occurs till point M on TP curve and MP curve. This is a situation of increasing returns to a factor.
(ii) Phase II-Diminishing Returns: This stage is between M to T on TP curve. Beyond OM units of labour, MP tends to decline and TP increases only at diminishing rate. This occurs between M and T on MP curve and TP curve. This is a situation of diminishing returns to a factor.
(iii) Phase III-Negative Return: This stage is beyond T on TP curve. Beyond OT units of labour, MP becomes negative. Now, TP starts declining. This is a situation of negative returns to a factor.
(b)
- MP initially rises to its maximum.
- MP then decreases (stays positive) to become zero.
- MP becomes negative.
Question 34.
Read the passage given below and answer the questions that are followed.
Every economy faces the problem of allocating the scarce resources to the production of different possible goods and services and of distributing the produced goods and services among the individuals within the economy. The allocation of scarce resources and the distribution of the final goods and services are the central problems of any economy. In general, every individual in society is engaged in the production of some goods or services and she wants a combination of many goods and services not all of which are produced by her. Needless to say that there has to be some compatibility between what people in society collectively want to have and what they produce. On the basis of the given text and common understanding, answer the following questions:
(a) State reasons why does an economic problem arise? [2]
(b) “Massive unemployment shifts the PPC to the left.” [4]
Defend or refute the above statement.
Answer:
(a) There are three reasons :
- Wants of people are unlimited: It is due to unending circle of wants. After the satisfaction of one want, another want arises.
- Resources are limited: Problem of allocation of resources arises because resources are not enough to satisfy wants of every individual.
- Resources have alternative uses: Scarce resources have alternative uses. When an individual chooses to use a given resources for something, he/she is unable to use that resources for anything else.
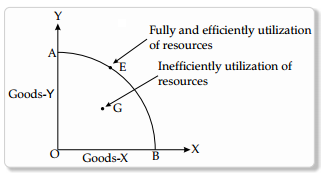
(b) The given statement is refuted. PPC is drawn on the assumption that the given resources are fully and efficiently utilised. Unemployment is a situation when resources are inefficiently utilised or underutilised. It means that the economy would not operate on the PPC but somewhere inside the PPC.
The following figure indicates this situation:
