Each of our Maths Mela Class 5 Worksheet and Class 5 Maths Chapter 15 Data Through Pictures Worksheet with Answers Pdf focuses on conceptual clarity.
Class 5 Maths Chapter 15 Data Through Pictures Worksheet with Answers Pdf
Data Through Pictures Class 5 Maths Worksheet
Class 5 Maths Chapter 15 Worksheet with Answers – Class 5 Data Through Pictures Worksheet
Ice Cream Survey
Riya and Arjun wanted to do something fun and informative for their class project. They decided to act like young researchers and find out how many ice cream their classmates eat in a week.
Armed with a notebook and lots of curiosity, they asked 40 friends:
They recorded the responses like this:
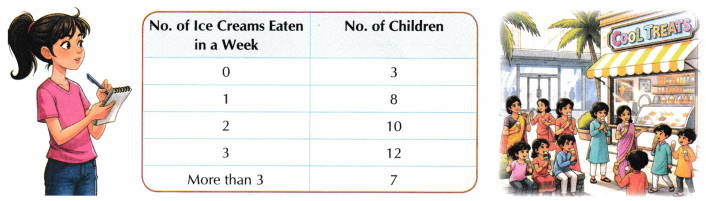
Look at the table and answer the following questions.
Question 1.
How many children eat more than 2 ice creams in a week? ____________
Question 2.
How many children eat less than 2 ice creams in a week? ____________
Question 3.
The number of children who eat exactly 2 ice creams is ____________.
Question 4.
More children ate 3 ice creams than 1 ice cream during the week. (True/False)
Question 5.
The number of children who ate no ice cream is ____________ less than those who ate 3 ice creams during the week.
Stock-Taking In a Shop (Fruit Stall)
A week before the spring festival, Neha Aunty decided to take stock of the fruits in her stall. She noticed there were too many fruits of each kind, and it was not easy to keep the record by drawing a picture for every fruit.
Ravi, her helper, suggested using one picture (icon) to represent 10 units/bunches of kinds of fruits.
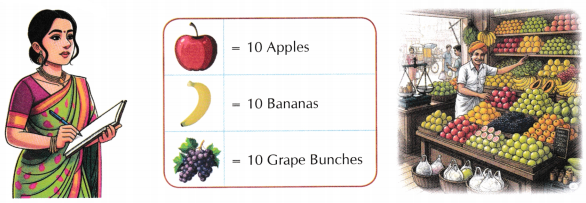
Here is the pictograph Neha Aunty made:

Question 6.
How many apples does Neha Aurtty have?
______________________________
Question 7.
How many bananas does Neha Aunty have?
______________________________
Question 8.
How many bunches of grapes does Neha Aunty have?
______________________________
Question 9.
How many total units/bunches does Neha Aunty have?
______________________________
Question 10.
Can you think for a different scale to show the same data in a pictograph?
______________________________
![]()
Bicycles on the Park Track
Anaya counted the number of bicycles passing through the park in one hour on three different days.

She used one bicycle icon to show 5 bicycles.
Observe the pictograph and answer the questions:

Question 11.
Which day had the most bicycles passing the park?
______________________________
Question 12.
How many bicycles did she record on Tuesday?
______________________________
Question 13.
How many more bicycles were seen on Thursday than on Saturday?
______________________________
Question 14.
How many total bicycles were counted over the three days?
______________________________
Recording a Day (Week)
Ria and Aarav decided to track the hours they spent on their hobbies over one week.
Ria recorded her data in a table, while Aarav used a bar garaph.
Ria’s table:
| Hobbies | Hours Spent |
| Story Reading | 6 |
| Painting | 4 |
| Playing Cricket | 8 |
| Gardening | 5 |
| Watching TV | 7 |
Aarav’s bar graph:
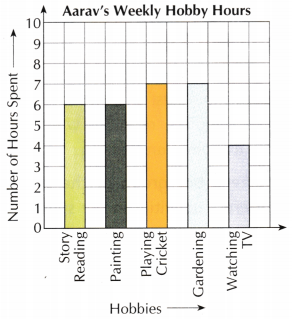
Question 15.
Whose hobby List shows more time spent on playing cricket?
______________________________
Question 16.
Who spends more hours on watching TV?
______________________________
Question 17.
How many more hours does Aarav spend on gardening compared to Ria?
______________________________
Question 18.
Is there any hobby that they spend the same amount of time? If yes, name it.
______________________________
Question 19.
Based on their data, whose weekly routine seems more balanced? Why?
______________________________
Weekly Sports Practice
Aryan recorded the number of hours he spent on different sports during one week.
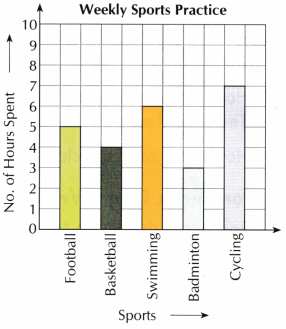
Question 20.
Which sport did Aryan spend the most time practising?
______________________________
Question 21.
On which sport did he spend the least time?
______________________________
Question 22.
How many more hours did he spend cycling than playing basketball?
______________________________
Question 23.
What is the total time Aryan spent on sports in the week?
______________________________
![]()
Day in My Life
Record how you spend your Sunday (24 hours) in hours and minutes. Mention the time for activities such as sleeping, reading, watching TV, playing, helping at home, and eating.
| Activity | No. of Hours |
| Sleeping | |
| Reading | |
| Watching TV | |
| Playing | |
| Helping at home | |
| Eating |
Question 24.
Make a bar graph of the time you spend on different activities in the space given below.

Activity
Whose Eraser Is longer?
Cut long paper strips from waste paper. Give one strip (each of the same width) to each of your friends. Ask them to place the strip of paper beside the eraser and mark its length and tear off the extra strip extending above the eraser.
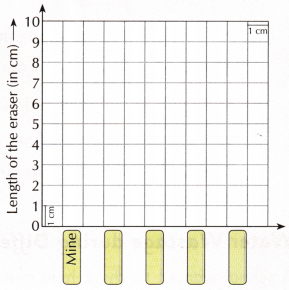
Paste these paper strips vertically on the bar graph with student names at the bottom.
Question 25.
Write the answers to the following questions based, on gour graph.
(a) Whose eraser is the longest? ____________
(b) The length of the longest eraser is ____________ cm.
(c) The length of the smallest eraser is ____________ cm long.
(d) It belongs to ____________
Question 26.
Observe the picture of a school playground carefully.

Based on your observation, decide whether the JoUawihg statements are true or false.
(a) All boys are wearing sports shoes. ____________
(b) 8 students are holding cricket bats. ____________
(c) More girls are holding badminton rackets than boys. ____________
(d) Less than half of the students are wearing caps. ____________
(e) The number of students holding rugby balls is greater than the number of students holding cricket bats. ____________
Water Wastage during Different School Activities
A school wanted to check how much water was being wasted in different daily activities.
The data collected for water wastage during various activities is shown using the bar graph.
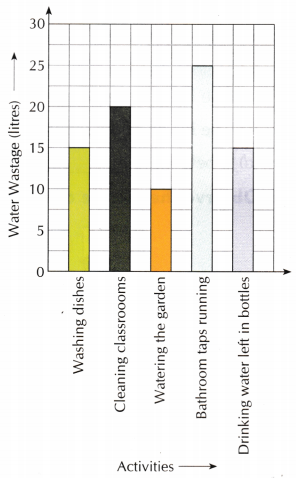
Question 27.
Which activity wasted the most water?
______________________________
Question 28.
Which activity wasted the least water?
______________________________
Question 29.
What was the total water wastage in all activities?
______________________________
![]()
Question 30.
If 1 litre of water can fill 2 bottles, how many bottles could have been filled with the total water wasted?
______________________________
______________________________