Students rely on Class 6 Maths Extra Questions Chapter 4 Data Handling and Presentation Class 6 Extra Questions and Answers to improve their grades.
Class 6 Maths Chapter 4 Extra Questions Data Handling and Presentation
Class 6 Maths Data Handling and Presentation Extra Questions
NCERT Class 6 Maths Chapter 4 Data Handling and Presentation Extra Questions and Answers
Very Short Answer Type Questions
Question 1.
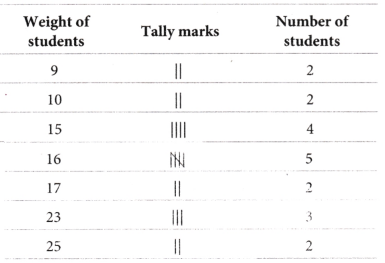
The following are the weight (in kg) of 20 students of a class 25,16,17,15, 23, 10, 9,15, 16, 17,15,16, 23, 25, 16,15, 23, 9, 10, 16
Prepare a table using tally marks for the given data.
Answer:
Question 2.
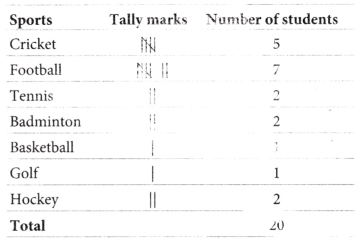
Following is the choicd of sports for 20 students of Class VI. Cricket, Football, Cricket, Tennis, Cricket, Badminton, Football, Cricket, Football, Tennis, Cricket, Badminton, Basketball, Football, Golf, Football,
Hockey, Football, Hockey, Football. Arrange the names of sports in a table using tally marks.
Answer:
Question 3.
In a pictograph, a symbol represents 5 persons, then how many symbols represent 20 persons?
Answer:

![]()
Question 4.
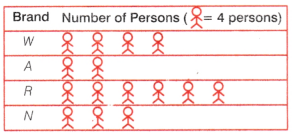
The pictograph shows the number of persons using various brands of perfumes.
Answer:
6 × 4 = 24 persons
Question 5.
Following bar graph, shows the number of children in six different classes.
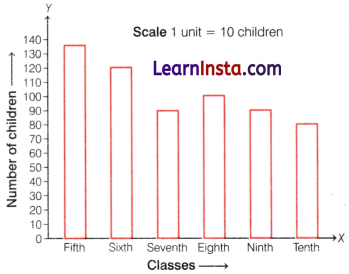
Which class has the maximum number of children and minimum number of children?
Answer:
From the graph, maximum number of children are in class fifth i.e. 135 and minimum number of children are in class tenth i.e. 80.
Short Answer Type Questions
Question 1.
The following pictograph shows the number of private buses in six cities.
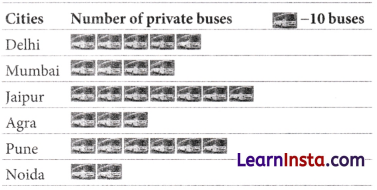
By observing the given pictograph, answer the following questions.
(i) In which city the number of private buses are least?
(ii) In which city the number of private buses are highest?
(iii) How many more buses are in Delhi as compared to Agra?
(iv) Find the total number of buses in all the six cities.
Answer:
(i) Noida
(ii) Jaipur
(iii) 20
(iv) 270
Question 2.
In a electrical shop, the sale of fans on different days of a week is shown by below pictograph.
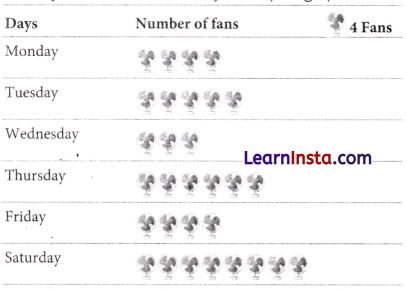
By observing the given pictograph answer the following questions.
(i) Find the number of fans sold on Tuesday.
(ii) On which of the days, the number of fans were sold is same?
(iii) On which day, the number of fans were sold is maximum?
(iv) On which day, the number of fans were sold is minimum?
Answer:
(i) 20
(ii) Monday and Friday
(iii) Saturday
(iv) Wednesday
Question 3.
Following is the pictograph of the number of cycles manufacture by a factory on six different working days of a week.
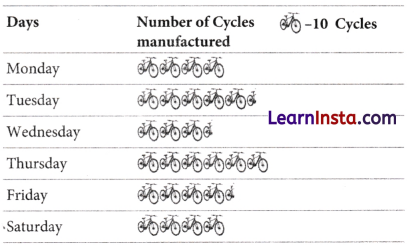
By observing the given pictograph and answer the following questions.
(i) On which day were the least number of cycles manufactured?
(ii) On which day were the maximum number of cycles manufactured?
(iii) Find the approximate number of cycles manufactured in all the six working days of the given week.
(iv) On which of the days, the number of cycles manufactured is same?
Answer:
(i) Wednesday
(ii) Thursday
(iii) 275
(iv) Monday and Saturday
Question 4.
The blood groups of 25 students are recorded as follows
A, B, 0, A, AB, 0, A, 0, B, A, 0,B, A, AB, AB, A, A. B, B, 0, B, AB, 0, A, B. Arrange the information in a table using tally marks.
Answer:
The information in a table using tally marks is follows :
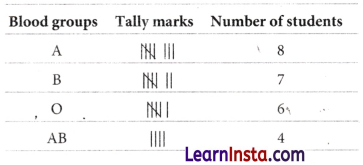
Question 5.
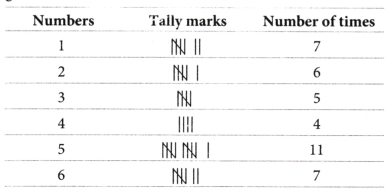
Rakesh is playing with a dice. He threw the dice 40 times and noted the outcomes as follows.
1, 2,1, 5, 3, 5, 5, 3, 2, 2,1, 6, 6, 6, 4, 6, 3, 5, 2, 3, 3, 5, 4,1, 5, 5, 2, 4, 5, 5, 2, 4, 1, 6, 6,1, 5, 6, 1, 5.
Prepare a table using tally marks.
Answer:
We draw the following table using tally marks from given information.
![]()
Question 6.
Following bar graph shows the data of favourite ice-cream flavour of consumers polled in a Survey.
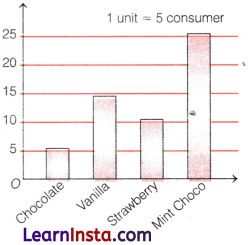
Observe the above bar graph and answer the following questions.
(i) Which ice-cream flavour is most popular?
(ii) How many consumer like the vanilla ice-cream flavour?
(iii) Try to find out the name of ice-cream flavour liked by the minimum consumer.
Answer:
(i) It is clear from the graph that mint choco ice-cream flavour is the most popular.
(ii) Given, 1 unit = 5 consumers
∴ Number of consumer like vanilla ice-cream flavour = 14 × 5 = 70
(iii) Chocolate
Question 7.
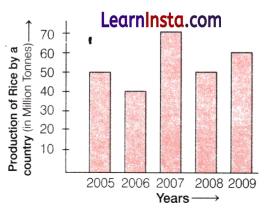
One day Mr. Rahul noted the data on how many production of rice by a country during five consecutive years. Data is given below.

(i) Draw a bar graph for above given data.
Answer:
(ii) Which year production of rice was maximum?
Answer:
It is clear from the graph, in year 2007, the production of rice was maximum.
Long Answer Type Questions
Question 1.
The following pictograph depicts the information about the areas in sq km (to nearest hundred) of some districts of Chhattisgarh State.
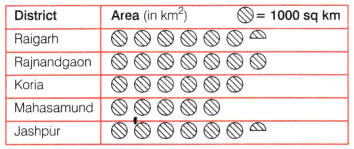
(i) What is the area of Koria district ?
(ii) Which district has small area?
(iii) Which district has large area?
(iv) Which two districts have the same area?
(v) How many districts have area more than 5000 Sq. km?
Answer:
(i) Area of Koria district = 6000 sq km
(ii) Mahasamund
(iii) Raigarh and Jashpur
(iv) Raigarh and Jashpur have the same area.
(v) Four districts have area more than 5000 sq km.
Question 2.
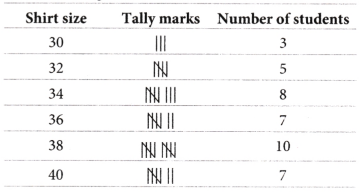
Fill in the blanks in the following table, which represents shirt size of 40 students of a school.
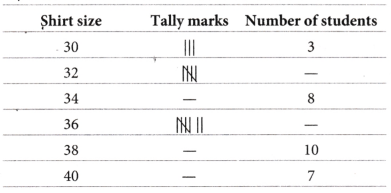
Answer:

Thus, the complete table is shown below
Question 3.
The number of scouts in a school is depicted by the following pictograph.
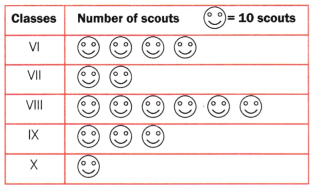
Observe the pictograph and answer the following questions.
(i) Which class has the minimum number of scouts?
(ii) Which class has the maximum number of scouts?
(iii) How many scouts are there in Class VI?
(iv) Which class has exactly four times the scouts as that of Class X?
(v) What is the total number of scouts in the classes VI 1 toX?
Answer:
(i) Class X has minimum number of scouts i.e. 10.
(ii) Class VIII has maximum number of scouts i.e. 60.
(iii) Number of scouts in Class VI =40
(iv) Number of scouts in Class X = 10
Hence, Class VI has exactly four times the scouts as that of Class X.
(v) Total number of scouts in classes VI to X
= 40 + 20 + 60 + 30 + 10 = 160
![]()
Question 4.
Use the following bar graph to answer the questions.
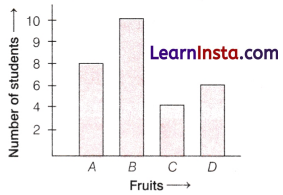
A = Orange; B = Mango; C = Grapes; D = Apple
(i) Which is the most popular fruit among the students?
(ii) Which is the least popularfruit among the students?
(iii) How many students like orange?
(iv) If in the given bar graph, 1 unit represents 5 students, then try to find out the number of students like orange.
Answer:
(i) Clearly, from the bar graph, mango is liked by 10 students. So, the most popular fruit among the students is mango.
(ii) Clearly, from the bar graph, grapes is liked by 4 students. So, the least popular fruit among the students is grapes.
(iii) Orange is liked by 8 students.
(iv) Given, 1 unit = 5 students
Number of students whose like orange = 8 × 5 = 40 students.
Question 5.
Number of children in six different classes are given below.
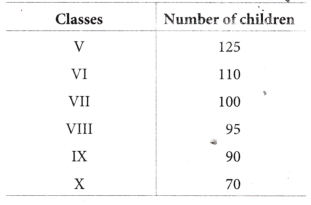
(i) Draw a bar graph for the given data.
(ii) Which class has the highest number of students.
Answer:
(i) Representation of number of students in different classes (from V to X).
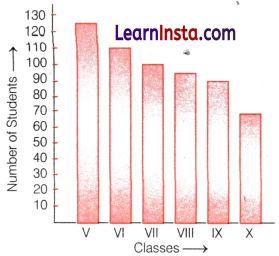
(ii) It is clear from the graph that class V has the highest number of students.
Case-Based Questions
Question 1.
Shod works for a shoe store. He records the shoe sizes and the number of pairs sold every day. On Tuesday, he sold 60 pairs. His record for the day is shown below.
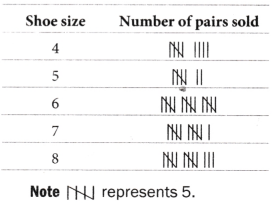
(i) How many pairs of size 8 were sold on Tuesday?
(a) 3
(b) 10
(c) 11
(d) 13
Answer:
(d) On Tuesday, Shobit sold 13 pairs of shoes of size 8.
(ii) Which shoe size sold the most?
(a) 6
(b) 7
(c) 8
(d) 9
Answer:
(a) Shoe size 6 sold the most.
(iii) Shobit realised that he had not fully recorded the sale for Tuesday. How many sold pairs had he hot recorded?
Answer:
Shobit recorded the sale of 55 pairs for Tuesday, but he sold 60 pairs. Thus, he had not recorded 5 pairs of shoes.
(iv) The unrecorded data was of shoe size 7. Shobit corrected his record accordingly. Which of the following statements will be true now?
(a) Shoe size 8 sold the least now
(b) Shoe size 7 sold the most now
(c) Shoe size 5 is the new mode of the data
(d) Number of shoe pairs of size 3 can be calculated
Answer:
(b) The correct statements after Shobit corrected his record is that shoe size 7 sold the most now i.e. 16 pairs.
(v) The price of one shoe pair of size 5 is ₹ 800. How much money had Shobit collected by selling all the shoe pairs of size 5?
Answer:
Shobit sold 7 pairs of shoes of size 5 on Tuesday and the price of one shoe pair of size 5 is ₹ 800.
Thus, the money collected by selling all the shoe pairs of size 5 = 7 × 800 = ₹ 5600.
![]()
Question 2.
Class teacher asked to Manya to collect the data of marks obtained by top five students of the class in Math test. Manya collect the data and represent the data by following bar graph
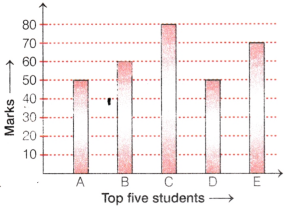
On the basis of above information, answer the following questions.
(i) The maximum marks obtained by any student is
(a) 50
(b) 60
(c) 65
(d) 80
Answer:
(d) It is clear from the graph, the maximum marks obtained by any student is 80.
(ii) The minimum marks obtained by any student in all five students is
(a) 40
(b) 50
(c) 60
(d) 65
Answer:
(b) It is clear from the graph that students A and D got equal and minimum marks as 50 marks.
(iii) How many students got the same marks?
(a) 1
(b) 2
(c) 3
(d) None of the above
Answer:
(b) Two students A and D got equal marks.
(iv) Write the name of student, who got the marks between 60 to 80.
Answer:
Student E got the marks between 60 to 80.
Class 6 Maths Chapter 4 Extra Questions in Hindi आकड़ों का प्रबंधन और प्रस्तुतिकरण
Data Handling and Presentation Class 6 Extra Questions in Hindi
उदाहरण (हल सहित)
उदाहरण 1.
कक्षा VI के 30 विद्यार्थियों की मिठाइयों की पसंद निम्नलिखित हैं-
लड्डू, बर्फी, लड्डू, जलेबी, लड्डू, रसगुल्ला, जलेबी, लड्डू, बर्फी, रसगुल्ला, लड्डू, जलेबी, जलेबी, रसगुल्ला, लड्डू, रसगुल्ला जलेबी, लड्डू, रसगुल्ला, लड्डू, लड्डू, बर्फी, रसगुल्ला, रसगुल्ला, जलेबी, रसगुल्ला, लड्डू, रसगुल्ला, जलेबी, लड्डू।
(a) मिलान चिह्नों का उपयोग करके मिठाइयों को एक बारंबारता सारणी में व्यवस्थित करें।
(b) अधिकांश विद्यार्थियों को कौन-सी मिठाई पसंद है?
हल:
(a) मिठाइयों को मिलान चिह्नों का उपयोग करके सारणी में व्यवस्थित किया गया है जैसे कि नीचे दिखाया गया है।

(b) अधिकांश विद्यार्थियों को लड्डू पसंद है।
उदाहरण 2.
कैथरीन ने एक पासा 40 बार फेका और हर बार आने वाली संख्या को नोट किया जैसा कि नीचे दिखाया गया है।

एक सारणी बनाएँ और मिलान चिह्नों का उपयोग करके आँकड़े लिखें। संख्या ज्ञात करें।
(a) जो सबसे कम बार आई
(b) जो सबसे अधिक बार आई
(c) उन संख्याओं को ज्ञात करें जो समान बार आई।
हल:

(a) वह संख्या जो सबसे कम बार आई 4 है।
(b) वह संख्या जो सबसे अधिक बार आई 5 है।
(c) संख्या 1 और 6 बराबर बार आई।
उदाहरण 3.
इस दंड आलेख को देखिए जो सोमवार से शनिवार तक एक रेडीमेड कमीजों की दुकान में बिक्री को दर्शाता है।
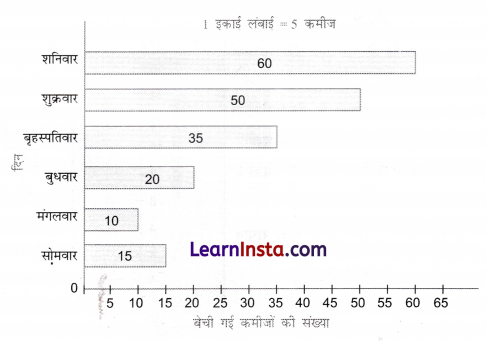
अब निम्नलिखित प्रश्नों के उत्तर दीजिए।
(a) उपरोक्त दंड आलेख क्या जानकारी देता है?
(b) कमीजों की संख्या को दर्शाने वाली क्षैतिज रेखा पर कौन-सा पैमाना चुना गया है?
(c) किस दिन सबसे अधिक कमीज बेची गई? उस दिन कितनी कमीजें बेची गई?
(d) किस दिन सबसे कम कमीज बेची गई?
(e) बृहस्पतिवार को कितनी कमीज बेची गई?
हल:
(a) उपरोक्त दंड आलेख एक रेडीमेड दुकान में सोमवार से शनिवार तक कमीजों की बिक्री के बारे में जानकारी देता है।
(b) क्षैतिज रेखा पर कमीजों की संख्या को दर्शाने के लिए चुना गया पैमाना, इकाई लंबाई = 5 बेची गई कमीज है।
(c) शनिवार को सप्ताह की अधिकतम कमीजें बेची गई। (60 कमीज)
(d) मंगलवार को सबसे कम कमीजें बेची गई।
(e) बृहस्पतिवार को 35 कमीज बेची गई।
![]()
उदाहरण 4.
इस दंड आलेख को देखिए जो अजय द्वारा अर्धवार्षिक परीक्षा में विभिन्न विषयों में प्राप्त अंकों को दर्शाता है।

दिए गए प्रश्नों के उत्तर दीजिए।
(a) दंड आलेख क्या जानकारी देता है?
(b) उस विषय का नाम बताइए जिसमें अजय ने अधिकतम अंक प्राप्त किए।
(c) उस विषय का नाम बताइए जिसमें उसे न्यूनतम अंक प्राप्त हुए।
(d) प्रत्येक विषयों का नाम और उनमें प्राप्त अंक बताइए।
हल:
(a) दंड आलेख अर्धवार्षिक परीक्षाओं में अजय द्वारा विभिन्न विषयों में प्राप्त अंकों को दर्शाता है।
(b) अजय ने हिंदी में अधिकतम अंक प्राप्त किए।
(c) अजय ने सामाजिक अध्ययन में न्यूनतम अंक प्राप्त किए।
(d) अजय द्वारा विभिन्न विषयों में प्राप्त अंक हैं।
| विषय के नाम | प्राप्त अंक |
| हिन्दी | 80 |
| अंग्रेजी | 60 |
| गणित | 70 |
| विज्ञान | 50 |
| सामाजिक अध्ययन | 40 |
उदाहरण 5.
दंड आलेख को पढिए और निम्नलिखित प्रश्नों के उत्तर दीजिए।
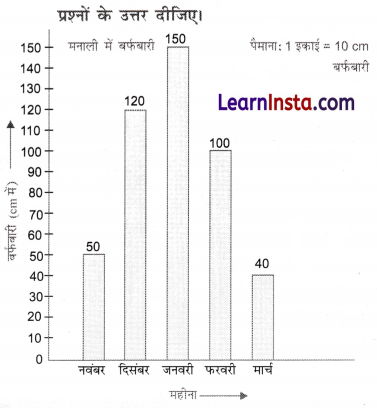
(a) मार्च महीने में कितने सेंटीमीटर की बर्फबारी हुई?
(b) क्या जनवरी में दिसंबर की तुलना में अधिक सेंटीमीटर बर्फबारी हुई?
(c) क्या नवम्बर में मार्च की तुलना में कितनी और अधिक सेंटीमीटर बर्फबारी होती है?
(d) कौन से महीने से आप देखते हैं कि बर्फबारी लगातार घट रही है?
हल:
(a) मार्च के महीने में 40 सेंटीमीटर बर्फबारी हुई।
(b) 150 सेमी 120 सेमी = जनवरी के महीने में दिसंबर की तुलना में 30 सेमी अधिक बर्फबारी हुई।
(c) नवंबर में 50 सेमी – 40 सेमी = 10 सेमी की बर्फबारी मार्च की तुलना में अधिक है।
(e) हम जनवरी महीने से लगातार बर्फबारी में कमी देख रहे हैं।
उदाहरण 6.
निम्न तालिका वर्ष 2018 से 2022 के दौरान एक कारखाने में निर्मित साइकिलों की संख्या दर्शाती है। इस आँकड़े को दंड आलेख का उपयोग करके दर्शाएँ। अपनी पसंद का पैमाना चुनें।
| वर्ष | उत्पादित साईकिलों की संख्या |
| 2018 | 800 |
| 2019 | 600 |
| 2020 | 900 |
| 2021 | 1100 |
| 2022 | 1200 |
(a) किस वर्ष में अधिकतम संख्या में साइकिलों का उत्पादन हुआ?
(b) किस वर्ष में न्यूनतम संख्या में साइकिलों का उत्पादन हुआ?
हल:
दंड आलेख खींचने के चरण
(i) एक ऊर्ध्वाधर और एक क्षैतिज दो लंबवत रेखाएँ खींचें,
(ii) क्षैतिज रेखा के अनुदिश, ‘वर्षों’ को चिह्नित करें।
(iii) ऊर्ध्वाधर रेखा के अनुदिश, “उत्पादित साईकिलों की संख्याओं” को चिह्नित करें।
(iv) दंड के बीच समान अंतर और चौड़ाई रखें।
(v) ऊर्ध्वाधर रेखा के साथ उपयुक्त पैमाना चुनें।
माना 1 इकाई लंबाई = 100 साइकिल । फिर संबंधित मानों को चिह्नित करें।
(vii) विभिन्न वर्षों के दंडों की ऊँचाई की गणना करें जो नीचे दी गई है:
2018 : 800 ÷ 100 = 8 इकाई
2019 : 600 ÷ 100 = 6 इकाई
2020 : 900 ÷ 100 = 9 इकाई
2021 : 1100 ÷ 100 = 11 इकाई
2022 : 1200 ÷ 100 = 12 इकाई
(viii) अब विभिन्न दंड खींचे।
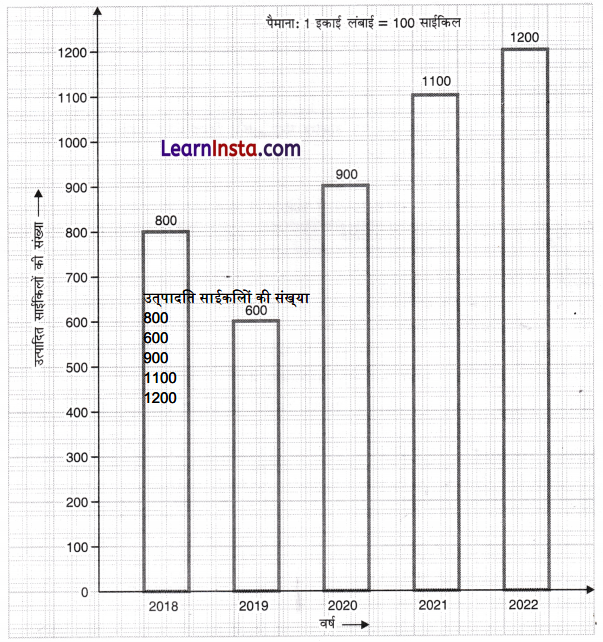
(a) 2022 में सबसे अधिक साइकिलों का उत्पादन हुआ।
(b) 2019 में न्यूनतम संख्या में साइकिलों का उत्पादन हुआ।
परीक्षापयोगी प्रश्न
प्रश्न 1.
एक सप्ताह के दौरान कक्षा से अनुपस्थित रहने वाले विद्यार्थियों की संख्या नीचे दी गई है-
| दिन | अनुपस्थितों की संख्या |
| सोमवार | 10 |
| मंगलवार | 20 |
| बुधवार | 25 |
| बृहस्पतिवार | 15 |
| शुक्रवार | 30 |
| शनिवार | 20 |
![]() चिह्न का उपयोग करके एक चित्रालेख बनाइए जो 10 विद्यार्थियों को दर्शाता है।
चिह्न का उपयोग करके एक चित्रालेख बनाइए जो 10 विद्यार्थियों को दर्शाता है।
हल:
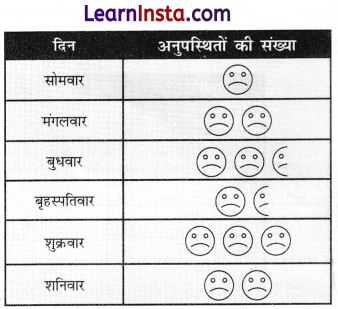
![]()
प्रश्न 2.
तीन अलग-अलग दुकानों द्वारा बेचे गए पेंट के डिब्बों की संख्या नीचे दी गई है-
| दुकान | बेचे गए पेंट के डिब्बों की संख्या |
| A | 100 |
| B | 120 |
| C | 160 |
एक चित्रालेख बनाएँ और निम्नलिखित प्रश्नों के उत्तर दें-
(a) दुकान B का कुल लाभ क्या है, यदि प्रत्येक टिन पर प्राप्त लाभ 100 रुपए है ?
(b) यदि प्रतीक ![]() , 20 डिब्बों को दर्शाता है, तो दुकान A के लिए कितने प्रतीक बनाने चाहिए?
, 20 डिब्बों को दर्शाता है, तो दुकान A के लिए कितने प्रतीक बनाने चाहिए?
(c) दुकान A और दुकान B द्वारा बेचे गए डिब्बों की संख्या में अंतर ज्ञात कीजिए।
हल:
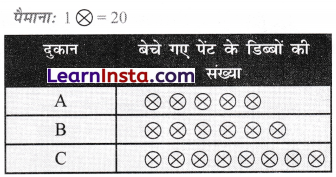
(a) दुकान B का लाभ = 100 × 120 = ₹ 12,000
(b) 5
(c) 20
प्रश्न 3.
दिया गया चित्रालेख एक सप्ताह के दौरान किसी कंपनी द्वारा बेचे गए डेस्कटॉप की संख्या दर्शाता है।
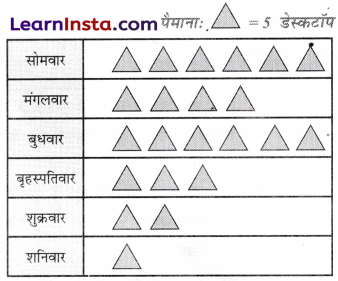
चित्रालेख को देखें और नीचे दिए गए प्रश्नों के उत्तर दीजिए-
(a) शनिवार को कितने डेस्कटॉप बेचे गए?
(b) सोमवार को कितने डेस्कटॉप बेचे गए?
(c) सप्ताह के दौरान कितने डेस्कटॉप बेचे गए?
(d) किन दो दिनों में बिक्री अधिकतम थी ?
(e) किस दिन बिक्री न्यूनतम थी?
हल:
(a) 5
(b) 30
(c) 110
(d) सोमवार और बुधवार
(e) शनिवार
प्रश्न 4.
निम्नलिखित चित्रालेख को पढ़ें और प्रश्नों के उत्तर दें-

(a) किस कक्षा ने सबसे अधिक किताबें पढ़ी हैं?
(b) किस कक्षा ने सबसे कम किताबें पढ़ी हैं?
(c) किन दो कक्षाओं ने समान संख्या में किताबें पढ़ी हैं?
(d) कक्षा IX द्वारा कक्षा X की तुलना में कितनी अधिक किताबें पढ़ी गई ?
हल:
(a) VIII
(b) X
(c) VII और IX
(d) 20
प्रश्न 5.
निम्न चित्रालेख एक पार्क में लगाए गए तीन अलग-अलग प्रकार के पेड़ों को दर्शाता है। प्रत्येक प्रतीक 10 पेड़ों को दर्शाता है। चित्रालेख को देखें और नीचे दिए गए प्रश्नों के उत्तर दें-
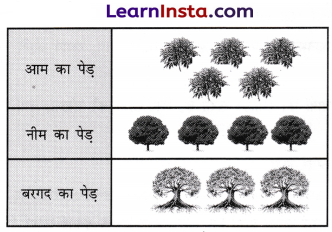
(a) कुल कितने आम के पेड़ हैं?
(b) कुल कितने नीम के पेड़ हैं?
(c) कुल कितने बरगद के पेड़ हैं?
(d) कुल कितने पेड़ हैं?
हल:
(a) 50
(b) 40
(c ) 30
(d) 120
प्रश्न 6.
एक क्षेत्र में लोगों द्वारा पसंद किए जाने वाले फ्रिज के रंग निम्नलिखित चित्रालेख द्वारा दिए गए हैं।
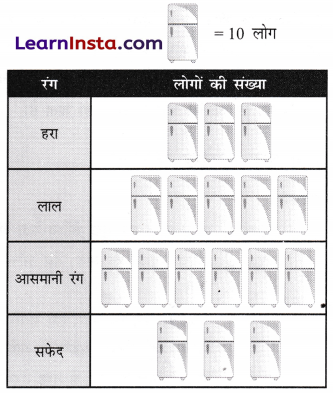
(a) आसमानी नीला रंग पसंद करने वोल लोगों की संख्या ज्ञात कीजिए।
(b) कितने लोगों को सफेद रंग पसंद है?
(c) सबसे अधिक लोगों को कौन-सा रंग पसंद है?
(d) सफेद रंग पसंद करने वाले लोगों की संख्या का
हरा रंग पसंद करने वाले लोगों की संख्या से अनुपात क्या है?
हल:
(a) 60
(b) 30
(c) आसमानी नीला रंग
(d) 3 : 3
![]()
प्रश्न 7.
दंड आलेख एक निश्चित सप्ताह के दौरान एक कारखाने द्वारा उत्पादित खिलौनों की संख्या को दर्शाता है-
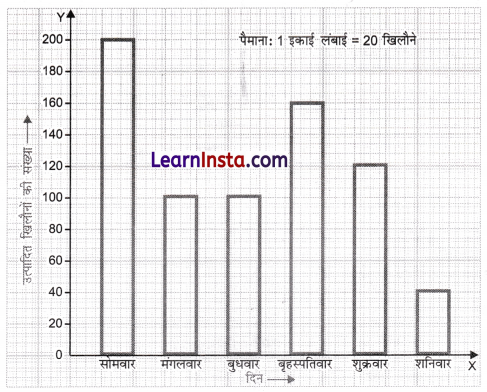
निम्नलिखित प्रश्नों के उत्तर दें-
(a) किस दिन सबसे अधिक संख्या में खिलौनों का उत्पादन किया गया?
(b) किस दिन सबसे कम संख्या में खिलौनों का उत्पादन किया गया?
(c) किन दो दिनों में बराबर संख्या में खिलौनों का उत्पादन किया गया?
(d) बृहस्पतिवार को शुक्रवार की तुलना में कितने अधिक खिलौनों का उत्पादन किया गया?
(e) सप्ताह के दौरान उत्पादित खिलौनों की कुल संख्या कितनी है?
हल:
(a) दंड आलेख से स्पष्ट है कि सोमवार को उत्पादित खिलौनों की सबसे अधिक संख्या = 200
(b) दंड आलेख से स्पष्ट है कि शनिवार को उत्पादित खिलौनों की सबसे कम संख्या = 40
(c) दंड आलेख से स्पष्ट है कि मंगलवार को उत्पादित खिलौनों की संख्या = बुधवार को उत्पादित खिलौनों की संख्या = 100
(d) दंड आलेख से स्पष्ट है कि बृहस्पतिवार को उत्पादित खिलौनों की संख्या = 160 और शुक्रवार को उत्पादित खिलौनों की संख्या = 120
(e) सप्ताह के दौरान उत्पादित खिलौनों की कुल संख्या = 200 + 100 + 100 + 160 + 120 + 40 = 720
प्रश्न 8.
कक्षा में घूमने के लिए कहाँ जाना है, यह तय करने के लिए वोट किया।
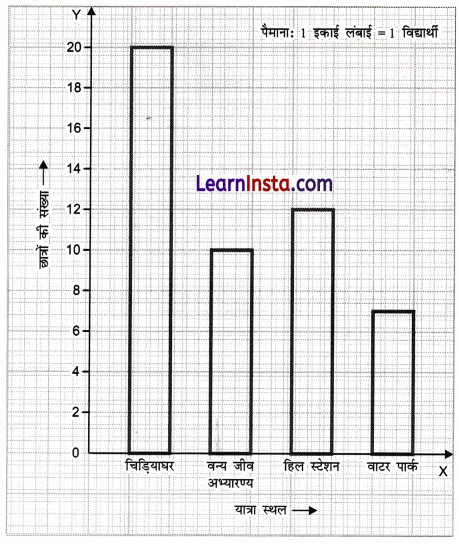
निम्नलिखित प्रश्नों के उत्तर दें-
(a) कक्षा में कितने छात्र थे ?
(b) अधिकांश छात्र कहाँ जाना चाहते थे?
(c) दूसरी पसंद कौन-सी थी ?
(d) कितने छात्रों ने वाटर पार्क के लिए वोट दिया ?
हल:
(a) कक्षा में छात्रों की कुल संख्या = 20 + 10 + 12 + 7 = 49
(b) चिड़ियाघर
(c) हिल स्टेशन
(d) 7
प्रश्न 9.
नीचे दिया गया दंड आलेख एक पब्लिक स्कूल में कक्षा VI से X के सेक्शनों की संख्या दर्शाता है। निम्नलिखित प्रश्नों के उत्तर देने के लिए दंड आलेख पढ़ें-
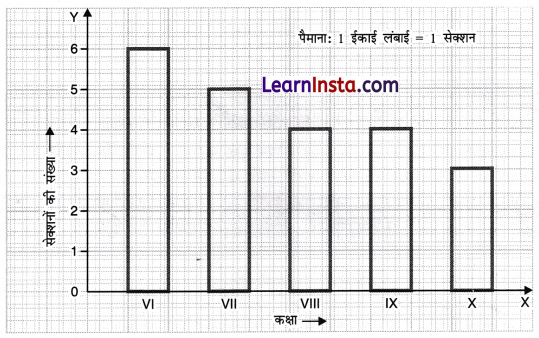
(a) कक्षा VI में कितने सेक्शन हैं?
(b) कक्षा X में कितने सेक्शन हैं?
(c) किन दो कक्षाओं में सेक्शनों की संख्या समान है ?
(d) किस कक्षा में 5 सेक्शन हैं?
(e) कक्षा VI और कक्षा X में सेक्शनों की संख्या का अनुपात क्या है ?
हल:
(a) 6
(b) 3
(c) VIII और IX
(d) VII
(e) कक्षा VI में सेक्शनों की संख्या = 6 और कक्षा X में सेक्शनों की संख्या = 3
अतः अभीष्ट अनुपात = 6/3 = 2/1 = 2 : 1
![]()
प्रश्न 10.
एक इलाके के 200 परिवारों के सर्वेक्षण में, प्रत्येक परिवार में बालिकाओं की संख्या दर्ज की गई और प्राप्त आंकड़ों को नीचे दिखाए गए दंड आलेख द्वारा दर्शाया गया-
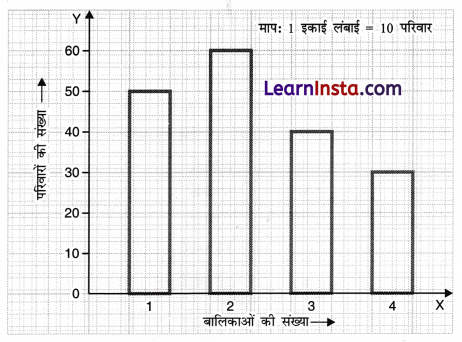
दंड आलेख को ध्यान से पढ़ें और नीचे दिए गए प्रश्नों के उत्तर दें-
(a) दंड आलेख क्या जानकारी देता है?
(b) कितने परिवारों में कोई बालिका नहीं है?
(c) कितने परिवारों में 3 बालिकाएँ हैं?
(d) कितने परिवारों में 4 बालिकाएँ हैं?
हल:
(a) दंड आलेख एक इलाके के 200 परिवारों में से प्रत्येक में बालिकाओं की संख्या दर्शाता है।
(b) 20
(c) 40
(d) 30