Students can easily access the best AI Class 10 Notes Chapter 2 AI Project Cycle Class 10 Notes for better learning.
Class 10 AI Project Cycle Notes
Foundational concepts of AI Class 10 Notes
Introduction to the AI Project Cycle: Artificial Intelligence (AI) has emerged as a transformative technology with the potential to revolutionise industries and reshape the way we live and work. To harness the power of Al effectively, organisations undertake structured processes known as AI project cycles. These cycles provide a systematic approach to developing AI solutions, from ideation to implementation and beyond.
What is Project Cycle?
In earlier classes, we studied about Water Cycle, etc. In the Water-Cycle, we studied that how is the journey of water carried out from one step to another till the end.
Like that in Project Cycle, we will deal with the steps involved in creating a project, starting from the given problem until the project is created and tested.
Project Cycle is a step-by-step process to solve problems using proven scientific methods and drawing inferences about them.
Let us take some daily examples as projects, requiring steps to solve the problem.
![]()
Let’s see one more example:
Creating a birthday card.
- Checking the factors like budget, etc Which will help us decide the next steps and understand the Project.
- Acquiring data from different sources like online, with friends, etc for Designs and ideas.
- Make a list of the gathered data.
- Creating or Modelling a card on the basis of the data collected.
- Showing it to Parents or cousins to Let them check it or evaluate it.
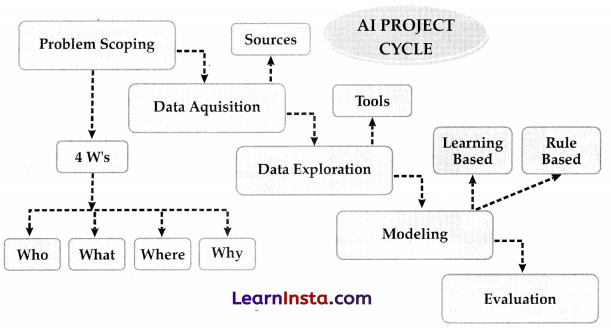
Components of the AI Project Cycle:
| Problem Scoping | Understanding the problem |
| Data Acquisition | Collecting accurate and reliable data |
| Data Exploration | Arranging the data uniformly |
| Modelling | Creating Models from the Data |
| Evaluation | Evaluating the project |
Problem Scoping: Every successful Al project begins with a clear understanding of the problem it aims to solve. This stage involves identifying pain points or inefficiencies that AI can address. For instance, a retail company may seek to improve inventory management by predicting demand patterns using machine learning algorithms. By pinpointing the problem, the organisation can define specific goals and set the project in the right direction.
Example: Amazon, the e-commerce giant, uses AI to optimise its supply chain operations. By analysing vast amounts of data, AI algorithms forecast product demand, allowing Amazon to stock its fulfillment centers strategically and minimise delivery times.
![]()
The AI project cycle provides a systematic framework for organisations to leverage AI technologies effectively. By following a step-by-step approach from problem identification to deployment and monitoring, businesses Artificial Intelligence (AI) has revolutionised numerous industries, ranging from healthcare and finance to transportation and customer service.
However, the success of AI systems depends heavily on the clarity and accuracy with which the problem at hand is scoped. Problem scoping in AI involves defining the specific objectives, constraints, and requirements of an AI project to ensure its successful implementation. In this article, we will explore a step-by-step approach to AI problem scoping, accompanied by suitable examples, to illustrate the significance of this crucial stage in AI development.
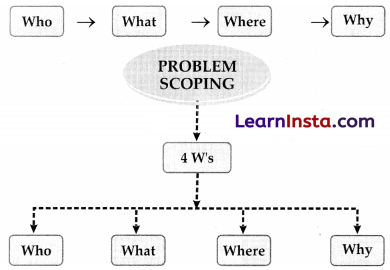
Problem Scoping refers to understanding a problem finding out various factors which affect the problem, define the goal or aim of the project.
4Ws of Problem Scoping :
The 4 W’s of Problem Scoping are Who, What, Where, and Why. This 4 Ws helps in identifying and understanding the problem in a better and more efficient manner
- Who: Who” part helps us in comprehending and categorising who are affected directly and indirectly by the problem and who are called the Stake Holders
- What: What” part helps us in understanding and identifying the nature of the problem and under this block, you also gather evidence to prove that the problem you have selected exists.
- Where: “Where” does the problem arise, situation, and location?
- Why: “Why” is the given problem worth solving?
We can take a look at the Sustainable Development Goals. 17 goals have been announced by the United Nations which is termed as the Sustainable Development Goals. The aim is to achieve these goals by the end of 2030 . A pledge to do so has been taken by all the member nations of the UN.

Here are the 17 SDGs. Let’s take a look:

As you can see, many goals correspond to the problems which we might observe around us too. One should look for such problems and try to solve them as this would make many lives better and help our country achieve these goals.
Scoping a problem is not that easy as we need to have a deeper understanding around it so that the picture becomes clearer while we are working to solve it. Hence, we use the 4 Ws Problem Canvas to help us out. Let us go through each of the blocks one by one.
Who
The “Who” block helps in analysing the people getting affected directly or indirectly due to it. Under this, we find out who the ‘Stakeholders’ to this problem are and what we know about them. Stakeholders are the people who face this problem and would be benefitted with the solution. Here is the Who Canvas:
Who is having the problem?
1. Who are the stakeholders?
2. What do you know about them?
![]()
What?
Under the “What” block, you need to look into what you have on hand. At this stage, you need to determine the nature of the problem. What is the problem and how do you know that it is a problem? Under this block, you also gather evidence to prove that the problem you have selected actually exists. Newspaper articles, Media, announcements, etc are some examples. Here is the What Canvas:
What is the nature of the problem?
1. What is the problem?
2. How do you know it is a problem?
Where?
Now that you know who is associated with the problem and what the problem actually is; you need to focus on the context/situation/location of the problem. This block will help you look into the situation in which the problem arises, the context of it, and the locations where it is prominent. Here is the Where Canvas:
Where does the problem arise?
1. What is context/situation in which the stakeholders experience the problem?
2. Where is the problem located?
Why?
You have finally listed down all the major elements that affect the problem directly. Now it is convenient to understand who the people that would be benefitted by the solution are; what is to be solved; and where will the solution be deployed. These three canvases now become the base of why you want to solve this problem. Thus, in the “Why” canvas, think about the benefits which the stakeholders would get from the solution and how it will benefit them as well as the society.
Why do you believe it is a problem worth solving?
1. What would be key value to the stakeholders?
2. How would it improve their situation?
![]()
After filling the 4 Ws Problem canvas, you now need to summarise all the cards into one template. The Problem Statement Template helps us to summarise all the key points into one single Template so that in future, whenever there is need to look back at the basis of the problem, we can take a look at the Problem Statement Template and understand the key elements of it.
Data Acquisition: The process of collecting accurate and reliable data to work with.
Acquiring high-quality and diverse data is crucial for training effective AI models. However, the data acquisition process can be complex and timeconsuming. In this article, we present a step-by-step guide to simplifying AI data acquisition, ensuring that you gather the right data efficiently. Each step is accompanied by examples to illustrate the process effectively.
Step 1: Define Your Data Requirements: Before diving into data acquisition, clearly define your project’s data requirements. Identify the specific data attributes, formats, and labels necessary for training your AI model. For example, if you’re building an image classification model to identify different species of birds, you would need a dataset consisting of labelled bird images.
Step 2: Determine Data Sources: Identify potential sources where you can acquire the required data. These sources can include public datasets, commercial data providers, social media platforms, or in-house data collections. For instance, if you need weather data for predicting rainfall, you might consider weather APIs, government databases, or meteorological research organisations as potential sources.
Step 3: Access Publicly Available Data: Many domains have publicly available datasets that can serve as a starting point. Explore platforms like Kaggle, UCl Machine Learning Repository, or data.gov for open datasets related to your project. For example, if you’re working on sentiment analysis, you can find prelabelled datasets of tweets or customer reviews.
Step 4: Create Data Crawlers and Scrapers: If the required data is not readily available, you can develop data crawlers or web scrapers to collect data from websites or online sources. Python libraries like BeautifulSoup or Scrapy can assist in automating this process. For instance, if you need news articles for a text summarisation model, you can build a web scraper to extract relevant articles from news websites.
Step 5: Collect User-Generated Content: In certain cases, user-generated content can be a valuable data source. Social media platforms like Twitter, Instagram, or Reddit provide APIs that allow access to public posts and comments. For instance, if you’re building a sentiment analysis model for brand reputation, you can gather relevant tweets mentioning the brand using Twitter’s API.
Step 6: Generate Synthetic Data: If obtaining realworld data is challenging, you can generate synthetic data that mimics the characteristics of your target dataset. Tools like data synthesis libraries or generative models can be used to create artificial samples. For example, in rare event prediction, you can use data generation techniques to create simulated instances of rare events.
![]()
Step 7: Annotate and Label Data: Depending on your project requirements, you may need labelled data for supervised learning. Annotate the acquired data by assigning appropriate labels or annotations. This step is crucial for training your AI model accurately. For example, if you’re building a chatbot, you may need to annotate user queries with intent labels.
Step 8: Ensure Data Privacy and Ethics: Respect privacy regulations and ethical considerations throughout the data acquisition process. Anonymise and protect personally identifiable information (PII) whenever necessary. Ensure compliance with data protection laws such as the General Data Protection Regulation (GDPR) or other relevant local regulations.
Step 9: Clean and Preprocess Data: Data cleaning and preprocessing are essential to ensure data quality and uniformity. Remove duplicates, handle missing values, and standardise formats to create a consistent dataset. For instance, if you’re analysing customer feedback, you might need to remove irrelevant or spammy comments.
Step 10: Validate and Verify Data: Perform data validation and verification to ensure the collected data meets your quality standards. Conduct sanity checks, statistical analyses, or cross-validation to identify and rectify any issues. For example, if you’re working on fraud detection, verify the integrity of the data by comparing it with known fraud cases.
Simplifying AI data acquisition involves a systematic approach encompassing defining requirements, identifying sources, accessing public datasets, using web scrapers, collecting user-generated content, generating synthetic data, annotating data, ensuring privacy and ethics, cleaning and preprocessing, and validating the acquired data. By following this step-by-step guide and adapting it to your specific project, you can simplify the data acquisition process and build more effective AI models.
Data Features :
Look at your problem statement once again and try to find the data features required to address this issue. Data features refer to the type of data you want to collect. In our previous example, data features would be salary amount, increment percentage, increment period, bonus, etc.
After mentioning the Data features, you get to know what sort of data is to be collected. Now, the question arises- From where can we get this data? There can be various ways in which you can collect data. Some of them are:
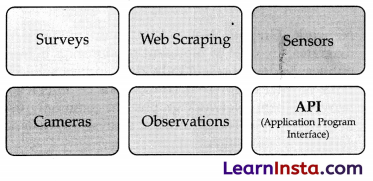
Sometimes, you use the internet and try to acquire data for your project from some random websites. Such data might not be authentic as its accuracy cannot be proved. Due to this, it becomes necessary to find a reliable source of data from where some authentic information can be taken.
At the same time, we should keep in mind that the data which we collect is open-sourced and not someone’s property. Extracting private data can be an offence. One of the most reliable and authentic sources of information, are the open-sourced websites hosted by the government. These government portals have general information collected in suitable format which can be downloaded and used wisely.
Some of the open-sourced Govt. portals are: data.gov. in, india.gov.in
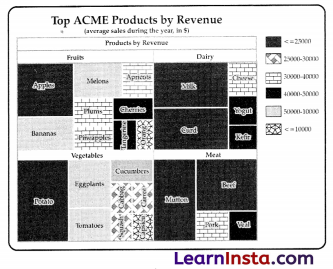
Data Exploration and Visualisation:
Data Exploration is the process of arranging the gathered data uniformly for a better understanding. Data can be arranged in the form of a table, plotting a chart, or making a database.
To analyse the data, you need to visualise it in some user-friendly format so that you can:
- Quickly get a sense of the trends, relationships, and patterns
- Define the strategy for which model to use at a later stage
![]()
Communicate the same to others effectively:
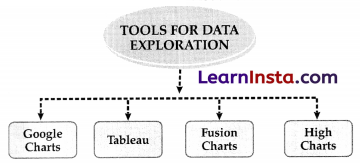
- Data Visualisation tools
- The tools used to visualise the acquired data are known as data visualisation or exploration tools.
- A few data visualisation tools are: Google Charts, Tableau, Fusion Charts, High charts
In today’s data-driven world, the sheer volume and complexity of information available to organisations can be overwhelming. From customer behaviour patterns to market trends, businesses are sitting on agoldmine of data that holds the potential to uncover valuable insights and drive strategic decision-making. However, extracting meaningful and actionable intelligence from this vast sea of data poses a significant challenge. This is where the advent of AI data exploration comes into play.
Al data exploration is revolutionising the way we analyse, interpret, and leverage data by harnessing the power of artificial intelligence. By combining advanced algorithms, machine learning, and computational capabilities, AI data exploration enables organisations to navigate the depths of their data and unearth hidden patterns, correlations, and trends. It empowers businesses to transform raw data into valuable knowledge, enhancing their understanding of various domains and empowering data-driven decisionmaking processes.
![]()
Example:
Let’s consider a retail company looking to improve its customer retention strategy. Traditionally, the company would have relied on manual analysis of customer transactions, surveys, and feedback to identify patterns and preferences. However, with the vast amount of data generated by online shopping platforms, social media interactions, and customer service logs, this approach is no longer feasible.
In the field of AI , there are various types of visualisations used to represent and analyse data. These visualisations help researchers, data scientists, and other stakeholders gain insights and understand patterns in the data. Here are some general types of visualizations commonly used in AI:
1. Line Charts: Line charts are used to display trends and patterns over time. They are useful for showing continuous data and can help visualise changes, fluctuations, or correlations.

2. Bar Charts: Bar charts are effective for comparing categories or discrete data. They use rectangular bars of varying lengths to represent values, making it easy to compare quantities across different categories.
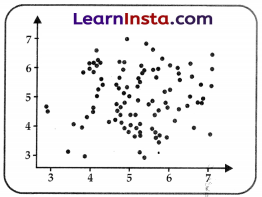
3. Scatter Plots: Scatter plots are used to visualise the relationship between two variables. Each data point is represented by a dot on the plot, and the position of the dot indicates the values of the variables. Scatter plots can reveal correlations or patterns in the data.
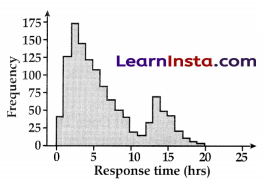
4. Histograms: Histograms are used to display the distribution of a single variable. They divide the data into bins or intervals and show the frequency or count of data points falling into each bin, creating a visual representation of the data’s distribution.
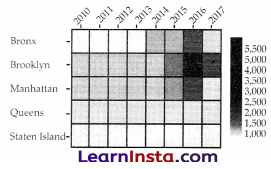
5. Heatmaps: Heatmaps are graphical representations of data where values are encoded as colors in a grid. They are commonly used to visualise matrices or tables, and the intensity of the color indicates the magnitude of the data values.
6. Pie Charts: Pie charts are circular charts divided into sectors, where each sector represents a category or proportion of the whole. They are useful for showing the proportions or percentages of different categories in a dataset.

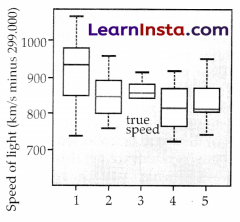
7. Box Plots: Box plots, also known as box-and-whisker plots, are used to display the distribution of a dataset and visualise summary statistics such as median, quartiles, and outliers. They provide a concise summary of the data’s spread and skewness.
8. Network Graphs: Network graphs, or node-link diagrams, are used to represent relationships between entities. Nodes represent individual entities, while the links or edges represent connections or interactions between them. Network graphs are commonly used in areas such as social network analysis or analysing complex relationships.

9. Treemaps: Treemaps are hierarchical visualisations that represent data as nested rectangles. The size of each rectangle corresponds to a quantitative value, while the nesting structure represents the hierarchical relationships between the categories.
These are just a few examples of the general types of visualisations used in AI. Depending on the specific data and analysis requirements, other specialised visualisations and techniques may also be employed.
– Other Data Exploration or Visualisation Tools
(a) Google Charts: Google chart tools are powerful, simple to use, and free. Try out our rich gallery of interactive charts and data tools.

(b) Tableau: Tableau is often regarded as the grandmaster of data visualisation software and for good reason. Tableau has a very large customer base of 57,000+ accounts across many industries due to its simplicity of use and ability to produce interactive visualisations far beyond those provided by general BI solutions.
(c) FusionCharts: This is a very widely-used, JavaScript-based charting and visualisation package that has established itself as one of the leaders in the paid-for market.
It can produce 90 different chart types and integrates with a large number of platforms and frameworks giving a great deal of flexibility.
(d) Highcharts: A simple options structure allows for deep customisation, and styling can be done via JavaScript or CSS. Highcharts is also extendable and pluggable for experts seeking advanced animations and functionality.

AI Modelling :
Modelling is the process in which different models based on the visualised Data can be created and even checked for the advantages and disadvantages of the model.
In this stage, AI models are developed and trained using the prepared data. Machine learning techniques, such as supervised learning, unsupervised learning, or reinforcement learning, are applied to build models that can make predictions, classify data, or perform other specific tasks. The models are refined through iterations to enhance their accuracy and performance.
In the world of Artificial Intelligence (Al), data modelling plays a pivotal role in uncovering valuable insights from vast amounts of information. Al data modelling involves the process of structuring, organising, and representing data in a way that allows AI systems to understand, learn, and make predictions. In this article, we will explore the fundamentals of AI data modelling, and its importance, and provide a practical example to illustrate its applications.
![]()
The Importance of AI Data Modelling: Data modelling is crucial for AI systems as it lays the foundation for accurate analysis and intelligent decision-making. By transforming raw data into a structured format, AI models can identify patterns, relationships, and trends that might not be apparent at first glance. This enables organisations to gain valuable insights, make datadriven decisions, and unlock new opportunities.
Key Components of AI Data Modelling:
- Data Collection
- Data Preprocessing
- Feature Engineering
- Model Selection
- Training and Evaluation
- Iterative Refinement
Let’s consider an example to illustrate how AI data modelling can be applied in a practical scenario. Suppose a telecommunications company wants to predict customer churn, i.e., identify customers who are likely to cancel their subscriptions. The company collects historical data on customer demographics, service usage, billing information, and churn status.
Data Collection: The company gathers customer data from its databases, including age, gender, monthly charges, contract type, and usage patterns.
Data Preprocessing: The data is cleaned, missing values are handled, and outliers are addressed. The company ensures that the data is accurate and consistent.
Feature Engineering: Relevant features are extracted or created, such as average monthly usage, payment history, tenure, and customer complaints.
Model Selection: Based on the nature of the problem and available data, the company selects a machine learning model, such as a random forest classifier or a neural network.
Training and Evaluation: The model is trained using the labelled dataset, where churn status is the target variable. The model’s performance is evaluated using metrics like accuracy, precision, recall, and F1-score.
![]()
Iterative Refinement: The model’s performance is analysed, and if necessary, the company revisits the feature set, adjusts hyperparameters, or tries different algorithms to improve accuracy.
By leveraging AI data modeling techniques, the telecommunications company can accurately predict customer churn, enabling them to take proactive measures such as targeted retention campaigns or personalised offers to reduce customer attrition.
Al data modelling is a powerful approach that allows organisations to extract valuable insights from their data, empowering data-driven decision-making and fostering innovation. By understanding the fundamentals of AI data modeling and following a systematic approach, businesses can leverage the potential of AI to gain a competitive advantage in today’s data-rich world.
Example: Healthcare organisations, like the Mayo Clinic, utilise AI models to predict patient outcomes. By analysing patient data, including medical records and genetic information, AI algorithms can help identify patterns and risk factors for specific diseases, enabling doctors to make more informed decisions and recommend personalised treatments.
Rule Based Approach: Rule Based Approach Refers to AI modelling where the relationship or patterns in data are defined by the developer. That means the machine works on the rules and information given by the developer and performs the task accordingly.
Ex: You trained your model with 100 images of applesand bananas. Now If you test it by showing an apple, it will figure out and tell if it’s an apple or not. Here Labelled images of apples and bananas were fed, due to which the model could detect the fruit.
Rule-Based Approach Refers to AI modelling where the relationship or patterns in data are defined by the developer.
That means the machine works on the rules and information given by the developer and performs the task accordingly.
For example: Suppose you have a dataset containing 100 images of apples and bananas each. Now you created a machine using Computer-Vision and trained it with the labelled images of apples and bananas. If you test your machine with an image of an apple it will give you the output by comparing the images in its datasets. This is known as the Rule-Based Approach.
![]()
In the ever-evolving field of artificial intelligence (AI), data modelling plays a crucial role in extracting meaningful insights and making informed decisions. Among various approaches, the rule-based approach stands out as an effective methodology for AI data modeling.
Real-World Applications:
Diagnostic Systems: Rule-based AI models have been successfully employed in medical diagnosis, where they analyse patient symptoms and medical history* to provide recommendations for treatment or further tests.
Fraud Detection: Financial institutions use rule-based models to identify patterns indicative of fraudulent activities, allowing for the timely detection and prevention of financial crimes.
Decision Support Systems: Rule-based AI systems are utilized in various domains, such as customer service and supply chain management, to provide decision support. These models help automate routine decisionmaking processes, improving efficiency and reducing errors.
In the Rule-based Approach we will deal with 2 divisions of the dataset:
1. Training Data – A subset required to train the model
2. Testing Data – A subset required while testing to trained the model
Training vs Testing Data
| Base | Training Set | Testing Set |
| Use | Used for Training the Model | Used for Testing the Model after it is trained |
| Size | Is a lot bigger than testing data and constitutes about 70% to 80% | It is smaller than Training Set and constitutes about 20% to 30% |

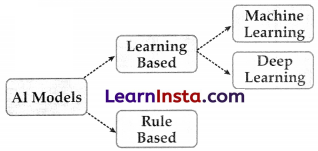
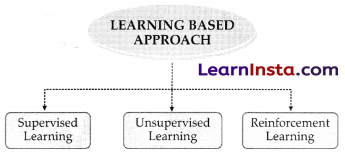
Learning Based Approach :
The learning-Based Approach is based on a Machine learning experience with the data fed.
AI systems heavily rely on data for training and decision-making. During this stage, relevant data is collected, curated, and prepared for analysis. The quality and diversity of data play a crucial role in the accuracy and effectiveness of AI models. It may involve data cleaning, feature engineering, and ensuring data privacy and security.
Example: Google’s self-driving car project, Waymo, collects extensive data from sensors, cameras, and lidar to train its AI models. The data includes images, video feeds, and sensor readings, which arecarefully annotated and labelled to enable the Al system to recognise and respond to various traffic scenarios.
In artificial intelligence (AI), a learning-based approach refers to a methodology where an AI system learns from data and experience to improve its performance on a given task. Instead of being explicitly programmed with all the rules and instructions, the AI system leverages algorithms and statistical techniques to automatically extract patterns and insights from the data it is exposed to.
There are several types of learning-based approaches in AI.
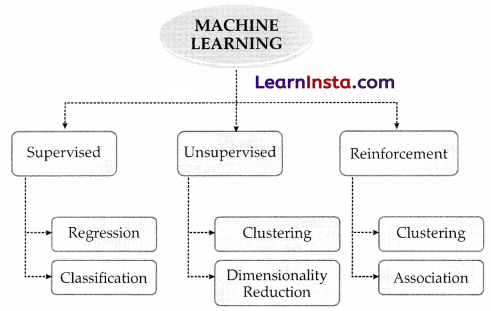
Types of Machine Learning
Machine learning can be divided into 3 types, Supervised Learning, Unsupervised Learning, and semi-supervised or Reinforcement Learning
Supervised Learning :
Supervised learning is where a computer algorithm is trained on input data that has been labelled for a particular output.
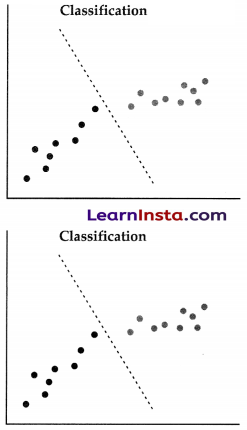
For example, a shape with three sides is labelled as a triangle, Classification, and Regression models are also types of supervised Learning
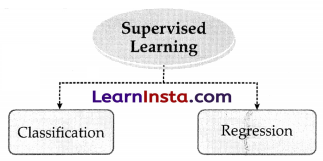
What is classification?
Classification is when the algorithm’s job is to separate the labelled data to predict the output.
Example: to predict weather which of them is apple and pineapple.
![]()
What is Regression?
Regression is a type of supervised learning which is used to predict continuous value.
Example: Regression is used to predict the weather. it is also used widely for weather forecasting.
Unsupervised Learning:
In terms of machine learning, unsupervised learning is in which a system learns through data sets created on its own. In this, the training is not labelled.
Learning on its own is termed Unsupervised learning. Basically, in unsupervised learning where the data is un-tagged or un-named, the machine creates a learning algorithm using its structural data sets present in its input.
Clustering: Refers to the unsupervised learning algorithm which can cluster the unknown data according to the patterns or trends identified out of it. The patterns observed might be the ones which are known to the developer or it might even come up with some unique patterns out of it.
Dimensionality Reduction: We humans are able to visualise upto 3-Dimensions only but according to a lot of theories and algorithms, there are various entities which exist beyond 3-Dimensions. For example, in Natural language Processing, the words are considered to be N -Dimensional entities. Which means that we cannot visualise them as they exist beyond our visualisation ability. Hence, to make sense out of it, we need to reduce their dimensions. Here, dimensionality reduction algorithm is used.
As we reduce the dimension of an entity, the information which it contains starts getting distorted. For example, if we have a ball in our hand, it is 3-Dimensions right now. But if we click its picture, the data transforms to 2-D as an image is a 2-Dimensional entity.
Now, as soon as we reduce one dimension, at least 50 % of the information is lost as now we will not know about the back of the ball. Whether the ball was of same colour at the back or not? Or was it just a hemisphere? If we reduce the dimensions further, more and more information will get lost.
Hence, to reduce the dimensions and still be able to make sense out of the data, we use Dimensionality Reduction.
Example: Suppose a boy sees someone performing tricks with a ball, so he also learns the tricks by himself. This is what we call unsupervised learning.
Reinforcement Learning:
Learning through feedback or trial and error method is called Reinforcement Learning.
In this type of learning, The system works on a Reward or Penalty policy. In this an agent performs an action positive or negative, in the environment which is taken as input from the system, then the system changes the state in the environment and the agent is provided with a reward or penalty.
The system also builds a policy, that what action should be taken under a specific condition.
Example: A very good example of these is Vending machines.

the amount of coin given (state) you get the drink corresponding to the amount(reward) if the coin is damaged or there is any another problem, then you get nothing (penalty).
Here the machine is building a policy that which drink should be provided under what conditions and how to handle an error in the environment.
Evaluation and Validation:
Once the Al model is trained, it needs to be rigorously evaluated and validated to ensure its effectiveness and reliability. This stage involves testing the model’s performance against predefined metrics and comparing it with existing benchmarks or human experts. Validation helps identify potential biases, errors, or limitations that need to be addressed before deployment.
Example: Social media platforms like Facebook employ Al algorithms to detect and moderate content that violates community guidelines. To ensure fairness and accuracy, these models undergo extensive evaluation to minimise false positives and false negatives, ensuring that legitimate content is not mistakenly flagged or allowed.
Evaluation: Evaluation in AI refers to the process of assessing the performance and quality of an AI system. It is crucial to evaluate AI models to determine their effectiveness, reliability, and generalizability. Evaluating AI models helps researchers, developers, and users understand the strengths and limitations of the system, and it plays a vital role in guiding further improvements.
An example of evaluation in AI can be seen in natural language processing (NLP) tasks, such as sentiment analysis. In sentiment analysis, the goal is to determine the sentiment (positive, negative, or neutral) expressed in a given text. To evaluate the performance of an AI model for sentiment analysis, several steps can be taken:
1. Data collection and annotation: A dataset of texts, labelled with their corresponding sentiment (positive, negative, or neutral), is collected. Human annotators review each text and assign the appropriate sentiment label.
2. Train-test split: The dataset is divided into two subsets: a training set and a test set. The training set is used to train the AI model, while the test set is kept separate for evaluation.
3. Model training: The AI model is trained using the labelled training set. Various machine learning or deep learning techniques may be employed, such as neural networks or support vector machines.
4. Evaluation metrics: To assess the model’s performance, evaluation metrics are used. Common metrics for sentiment analysis include accuracy, precision, recall, and Fl-score. These metrics provide insights into the model’s ability to correctly classify sentiments.
5. Testing and analysis: The trained model is then tested on a separate test set, and the evaluation metrics are computed based on the model’s predictions. The results are analysed to determine the model’s effectiveness in sentiment analysis.
6. Iterative improvement: Based on the evaluation results, further iterations of training tuning, and evaluation may be performed to improve the model’s performance. This iterative process helps refine the AI system and make it more accurate and reliable.
![]()
By following such evaluation processes, researchers and developers can measure the performance of AI models, identify potential weaknesses or biases, and make informed decisions regarding model selection or improvement strategies. Evaluation is essential for building trustworthy and robust Al systems across various domains.
7. Deployment and Monitoring: After successful validation, the AI model is deployed into a production environment. This stage involves integrating the model into the existing infrastructure, such as software systems or devices, and ensuring its seamless operation. Continuous monitoring is crucial to track the model’s performance, detect anomalies, and make necessary updates or improvements over time.
Example: Virtual assistants, such as Apple’s Siri or Amazon’s Alexa, are deployed on smartphones and smart speakers. These AI-powered assistants continuously learn from user interactions, improving their language understanding and response accuracy. Regular updates and monitoring enable these virtual assistants to adapt to user preferences and provide more personalised experiences.
Neural Networks: Neural Networks are series of networks of independent neurons just like in our brain, but in computers, neurons are not the living tissue it is just an algorithm which gives output based on given data
The key advantage of Neural Networks, are that they are able to extract data features automatically without needing the input of the programmer
A Neural Network is essentially a system of organising machine learning algorithms to perform certain tasks. It is a fast and efficient way to solve problems for which the dataset is very large, such as in images.
Neural Networks are collections of neurons containing specific algorithm which are networked together to solve a particular set of problems irrespective of data size
Why Neural Networks?
To understand clearly, let’s dive to its earlier stage!
If Else Era :
In earlier times people tried to solve big data related problems using if else statements, for better understanding let’s go through a example.
Example: Suppose we want to build an AI-enabled chat app that will talk to people just like any other human. for that we will write if statements (programming concept) checking if he/she stays “hello” we will reply “hi” but the problem in this is that we need to write 100 or 1000 lines of if- else logic which is very inefficient and bad practice in the programming world So we take apply concept of our brain to a machine cause we don’t have to think “if he says hello I will say hi” it’s not a command, the reply changes based on situation.
Neural Networks are base of an AI model. As input data increases the accuracy of AI increases
Solution: To overcome the disadvantages of if/else statements, people developed neural networks in computers using specific mathematical prediction algorithms. Due to this we code the AI once and give it a collection of data, which is then processed by these neural networks to give output and the output changes as data changes.
PHP stands for PHP hypertext preprocessor it is a recursive acronym.
Accuracy-Data Proportionality:
The main reason the Neural Networks are implemented to build AI because it learns as it get’s more data just like human, if we do something we collect data from surrounding and learn new things and by practicing it (i.e., getting more data on same thing) we get perfect and master it.
To get better idea see the graph given below.
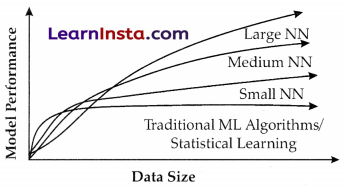
As seen in the figure given, the larger Neural Networks tends to perform better with larger amounts of data whereas the traditional machine learning algorithms stop after a certain saturation point.
How Neural Networks Work?
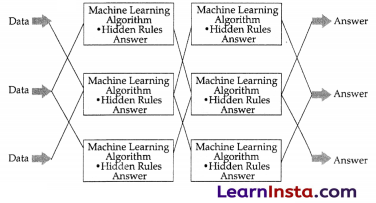
This is a representation of how neural networks work. A Neural Network is divided into multiple layers and each layer is further divided into several blocks called nodes.
Each node has its own task to accomplish which is then passed to the next layer. The first layer of a Neural Network is known as the input layer
The job of an input layer is to acquire data and feed it to the Neural Network. No processing occurs at the input layer. Next to it, are the hidden layers. Hidden layers are the layers in which the whole processing occurs. Their name essentially means that these layers are hidden and are not visible to the user.
![]()
Each node of these hidden layers has its own machine learning algorithm which it executes on the data received from the input layer. The processed output is then fed to the subsequent hidden layer of the network.
There can be multiple hidden layers in a neural network system and their number depends upon the complexity of the function for which the network has been configured Also, the number of nodes in each layer can vary accordingly. The last hidden layer passes the final processed data to the output layer which then gives it to the user.
Working of Neural Networks
Processing Layers in Neural Networks :
- Input Layer: The input layer of a neural network is composed of artificial input neurons, and brings the initial data into the system for further processing by subsequent layers of artificial neurons.
- The input layer is the very beginning of the workflow for the artificial neural network.
Hidden Layer:
- A hidden layer in an artificial neural network is a layer in between input layers and output layers, where artificial neurons take in a set of weighted inputs and produce an output through an activation function.
- It is a typical part of nearly any neural network in which engineers simulate the types of activity that go on in the human brain.
Output Layer:
- The output layer is responsible for producing the final result. There must always be one output layer in a neural network.
- The output layer takes in the inputs which are passed in from the layers before it, performs the calculations via its neurons and then the output is computed
- The interior layers are sometimes called “hidden layers” because they are not directly observable from the systems inputs and outputs.
Features of Neural Networks:
- Neural Network systems are modelled on the human brain and nervous system.
- They are able to automatically extract features without input from the programmer.
- Every neural network node is essentially a machine learning algorithm.
- It is useful when solving problems for which the data set is very large.