Students can easily access the best AI Class 10 Notes Chapter 5 Computer Vision Class 10 Notes for better learning.
Class 10 AI Computer Vision Notes
What is it?
Computer vision (CV): is a branch of Artificial Intelligence (AI) that allows computers to see and understand the world through images and videos. Imagine it as giving robots eyes and the ability to process visual information like humans.
Think of it this way:
- Input: Images and videos (digital eyes)
- Process: Analysing, understanding, and extracting information (brain at work)
- Output: Insights, predictions, actions (making sense of the visual world)
Now before we get into the concepts of Computer Vision, let us experience this domain with the help of the following game:
Emoji Scavenger Hunt:

Go to the link https://emojiscavengerhunt.withgoogle.com/ and try to play the game of Emoji Scavenger Hunt. The challenge here is to find 8 items within the time limit to pass.
Did you manage to win?
……………………………………………………………….
……………………………………………………………….
……………………………………………………………….
……………………………………………………………….
……………………………………………………………….
……………………………………………………………….
……………………………………………………………….
……………………………………………………………….
What was the strategy that you applied to win this game?
……………………………………………………………….
……………………………………………………………….
……………………………………………………………….
……………………………………………………………….
……………………………………………………………….
……………………………………………………………….
……………………………………………………………….
……………………………………………………………….
![]()
Was the computer able to identify all the items you brought in front of it?
……………………………………………………………….
……………………………………………………………….
……………………………………………………………….
……………………………………………………………….
……………………………………………………………….
……………………………………………………………….
……………………………………………………………….
……………………………………………………………….
Did the lighting of the room affect the identifying of items by the machine?
……………………………………………………………….
……………………………………………………………….
……………………………………………………………….
……………………………………………………………….
……………………………………………………………….
……………………………………………………………….
……………………………………………………………….
……………………………………………………………….
Why is it important?
CV plays a crucial role in various fields, including:
- Safety & Security: Facial recognition, anomaly detection for surveillance, autonomous vehicles
- Health: Medical image analysis, disease detection, robot-assisted surgery
- Access: Biometric authentication, smart home automation, visual assistance for the disabled
- Entertainment: Augmented reality, image editing, special effects
How does it work?
CV uses complex algorithms and machine learning techniques to:
- Identify objects and features: Recognise shapes, colours, textures, and patterns in images.
- Understand context: Analyse relationships between objects, their location, and movement.
Extract meaning: Draw conclusions and make predictions based on the information extracted.
Example:
- Imagine a self-driving car using CV. It can:
- Identify objects: Cars, pedestrians, traffic lights
- Understand context: Lane markings, traffic flow, speed limits
- Extract meaning: Decide whether to stop, turn, or accelerate
![]()
In simpler terms:
- CV = Seeing through pictures + understanding what you see + taking action based on that understanding. Remember:
- CV is not simply replicating human vision: it’s about extracting and analysing information from images in a way that’s valuable for computers.
- CV applications are constantly evolving and shaping our world in exciting ways.
Applications of Computer Vision:
Computer Vision: Seeing through the Machine’s Eye
This decade and the upcoming one are poised to witness a significant leap in technology, and computer vision is at the forefront of this revolution. Computer vision is a field of artificial intelligence that enables computers to understand and interpret the visual world. In simpler terms, it’s like giving machines the ability to “see” and process information from images and videos.
Common Applications of Computer Vision:
Facial Recognition: Imagine being able to identify a person from a grainy security camera footage. Facial recognition technology, powered by computer vision, does just that. It analyses facial features like eyes, nose, and jawline to create a unique biometric map, allowing for identification and verification.

Face Filters: Those fun and quirky filters you use on your selfies? They’re powered by computer vision too! Face filters track facial landmarks and manipulate them in real-time, adding glasses, hats, or even transforming your face into an animal.

Google Lens: Ever pointed your phone at a landmark and instantly gotten information about it? That’s Google Lens in action. It uses computer vision to analyse images and match them to its vast database, providing you with relevant information like names, locations, and even reviews.

Retail Stores: Say goodbye to checkout lines! Amazon Go, a futuristic store powered by computer vision, tracks your shopping journey and automatically bills you without any human interaction. Cameras and sensors follow your movements and detect the items you pick up, creating a seamless shopping experience.

Automotive Industry: Buckle up for the future of transportation! Self-driving cars, equipped with computer vision sensors and AI algorithms, are rapidly evolving. These cars can perceive their surroundings in 360 degrees, detect objects like pedestrians and vehicles, and navigate roads autonomously.

Healthcare: Computer vision is transforming the medical field as well. Medical imaging analysis, powered by AI is helping doctors diagnose diseases more accurately and efficiently. By analysing X-rays, CT scans, and MRIs, computer vision algorithms can identify abnormalities and tumors, leading to better patient care.

Google Translate App; Break down language barriers with the power of your smartphone! Google Translate app uses computer vision to translate text directly from images and signs. Simply point your camera at the text, and voila, you have the translation in your preferred language.
![]()
These are just a few examples of the many ways computer vision is impacting our lives. As the technology continues to evolve, we can expect even more exciting applications in fields like robotics, security, and entertainment. The future is bright, and computer vision is leading the way.


Application Domains of Computer Vision:
- Agriculture
- Autonomous vehicles
- Biometrics
- Character recognition
- Forensics, security, and surveillance
- Industrial quality inspection
- Face recognition
- Gesture analysis
- Geoscience
- Medical imagery
- Pollution monitorin
- Process control
- Remote sensing
- Robotics
- Transport
Computer vision is concerned with modeling and replicating human vision using computer software and hardware. Formally if we define computer vision then its definition would be that computer vision is a discipline that studies how to reconstruct, interrupt and understand a 3 d scene from its 2 d images in terms of the properties of the structure present in scene.
![]()
It needs knowledge from the following fields in order to understand and stimulate the operation of a human vision system.
- Computer Science
- Electrical Enginecring
- Mathematics
Image Processing:
Image Processing: Image processing is the method of transforming an image into a digital form and performing certain operations to get some senseful information from it.
Image Features:
A feature is a description of an image.
Features are the specific structures in the image such as points, edges or objects.
Other examples of features are related to tasks of CV motion in image sequences, or to shapes defined in terms of curves or boundaries between different image regions.
Image Extraction: This feature transforms raw data into numerical data for better conservation of the data and improving the machine learning results.
Object Detection: Object detection is a computer vision technique that allows us to identify and locate objects in an image or video.
Image Segmentation: Image Segmentation is the method which perform a digital image is partitioned into various subgroups in pixels called Image Objects, which can decrease the complexity of the image, and analysing the image becomes simpler.
Computer Vision Vs Image Processing: Imagine you’re a detective investigating a crime scene.
Image Processing: You meticulously analyse the photo evidence, adjusting brightness, sharpening blurry details, and enhancing colours to see everything clearly. This is like applying image-to-image transformations: manipulating the image itself.
Computer Vision: Now, you go beyond the picture. You interpret the scene, identifying objects like a broken window, a footprint, or a suspicious car. You even reconstruct the events based on the clues who was there, what happened, and why? This is the realm of constructing meaningful descriptions: extracting information and understanding the scene’s context.
Real-world applications:
Robotics: Imagine a robot navigating a factory floor. Image processing helps it see obstacles and adjust its path, while computer vision allows it to recognise objects and manipulate them with precision.
Medicine: Doctors use image processing to enhance medical scans, revealing tiny details. Computer vision then helps diagnose diseases by identifying tumors, analysing tissue samples, and even creating 3D models of organs for surgery planning.
![]()
Security: Facial recognition systems use image processing to capture faces, while computer vision analyses them to identify individuals or detect suspicious behaviour in security footage.
Transportation: Self-driving cars rely on both. Image processing clarifies road markings and traffic signals, while computer vision interprets the scene, identifying pedestrians, vehicles, and potential hazards to navigate safely.
Remember:
- Image processing is the “how” it manipulates the image itself.
- Computer vision is the “what” and “why” it interprets the image to understand its meaning and context.
- Think of them as two sides of the same coin, working together to unlock the secrets hidden within images.
Computer Vision: Getting Started Computer Vision is a domain of Artificial Intelligence, that deals with the images. It involves the concepts of image processing and machine learning models to build a Computer Vision based application.
Computer Vision Tasks:
The various applications of Computer Vision are based on a certain number of tasks which are performed to get certain information from the input image which can be directly used for prediction or forms the base for further analysis. The tasks used in a computer vision application are:

Applications of computers are based on several tasks that can be performed on the input image so as to perform Analysis or predict the output.

There are two methods of Computer Vision Task:
For Single Objects Classification and Classification + Localisation
Image Classification: Identifying the category of an object in an image. Think of it like sorting photos into folders like “cats,” “cars,” or “landscapes.
Example: A program that classifies X-ray images as “normal” or “pneumonia.”
Image Classification + Localisation:
Not only identifying the object’s category but also pinpointing its location in the image. Like labeling and marking a specific cat in a picture. Example: Self-driving cars using cameras to identify and locate pedestrians on the road.
For Multiple Objects Object Detection and Instance Segmentation
Object Detection: Finding instances of objects (not just their category) within an image. More like spotting all the cats, not just classifying the photo as “cats.”
Example: Facial recognition software detecting faces in a crowd.
![]()
Instance Segmentation: Assigning a unique label to each pixel belonging to an object, essentially separating and outlining individual instances. Imagine drawing precise circles around each cat in the picture.
Example: Medical imaging software segmenting tumors for accurate diagnosis and treatment planning.
Basics of Images Pixels: The Building Blocks of Images Imagine a mosaic. Each tiny tile forms the bigger picture, right? Similarly, pixels are the fundamental building blocks of any digital image. These tiny squares of information, typically arranged in a grid, determine the smallest unit of detail we see. The more pixels an image has, the closer it resembles the original object or scene, just like a finer mosaic offers a more intricate representation.

Resolution: How Densely Packed are the Pixels? Think of resolution as the “pixel density” of an image. It tells us how many pixels are crammed into a specific area, usually measured in width × heightt. For instance, a 1080 × 720 resolution image has 1080 pixels across its width and 720 pixels down its height. A higher resolution image (like 4 K ) packs more pixels into the same space, resulting in sharper details and smoother transitions. Remember, megapixels (million pixels) are a handy way to compare the overall pixel count of different images.
Pixel Values: Shades of Gray and Beyond
Each pixel has a value that dictates its brightness. On a scale of 0 to 255 (like a light dimmer switch!), 0 represents pitch black (no light) and 255 signifies pure white (maximum brightness). Shades of gray fall somewhere in between, with each shade representing an equal mix of the three primary colours: Red, Green, and Blue (RGB). These numbers are the language computers use to store and understand the images we see on our screens.
| Number of bits | Different patterns | Number of patterns | Number of patterns |
| 1 | 01 | 2^1 | 2 |
| 2 | 00 01 10 11 | 2^2 | 4 |
| 3 | 000 001 010 | 2^3 | 8 |
2^8 = 256
Grayscale Images: Where Colour Takes a Backseat Grayscale images are like black and white photographs, devoid of any vibrant hues. They showcase the tonal variations of a scene, where white is the brightest point and black is the darkest. Each pixel in a grayscale image holds a single value between 0 and 255 , representing the combined brightness level of the three primary colours. This simplified representation can be useful for certain applications, like medical imaging or artistic expressions.
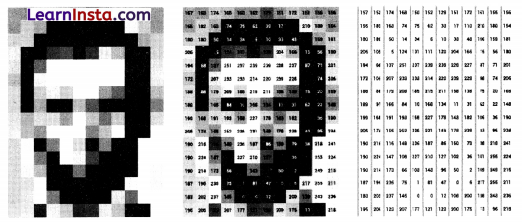
Here is an example of a grayscale image as you check, the value of pixels are within the range of 0-255. The computers store the images we see in the form of these numbers.
RGB Colours: The Symphony of Light
The magic of colour in digital images lies in the interplay of three primary colours: Red, Green, and Blue. Every colour you see on your screen is a unique blend of these three in varying intensities. Computers store RGB images in three separate channels one for each primary colour allowing for the creation of a vast spectrum of vibrant hues. Understanding this concept is crucial for anyone who wants to delve deeper into the world of digital graphics and image manipulation.

Let us experience:
Go to this online link URL https://www.w3schools.com/ colours/colours_rgb.asp. On the basis of this online tool, try and answer all the below mentioned questions.
What is the output colour when you put R = G = B =255?
………………………………………………………….
………………………………………………………….
………………………………………………………….
………………………………………………………….
………………………………………………………….
………………………………………………………….
………………………………………………………….
………………………………………………………….
![]()
What is the output colour when you put R = G = B = 0 ?
………………………………………………………….
………………………………………………………….
………………………………………………………….
………………………………………………………….
………………………………………………………….
………………………………………………………….
………………………………………………………….
………………………………………………………….
How does the colour vary when you put either of the three as 0 and then keep on varying the other two?
………………………………………………………….
………………………………………………………….
………………………………………………………….
………………………………………………………….
………………………………………………………….
………………………………………………………….
………………………………………………………….
………………………………………………………….
How does the output colour change when all the three colours are varied in same proportion ?
………………………………………………………….
………………………………………………………….
………………………………………………………….
………………………………………………………….
………………………………………………………….
………………………………………………………….
………………………………………………………….
………………………………………………………….
What is the RGB value of your favourite colour from the colour palette?
………………………………………………………….
………………………………………………………….
………………………………………………………….
………………………………………………………….
………………………………………………………….
………………………………………………………….
………………………………………………………….
………………………………………………………….
Were you able to answer all the questions? If yes, then you would have understood how every colour we see around is made.
Now the question arises, how do computers store RGB images? Every RGB image is stored in the form of three different channels called the R channel, G channel and the B channel.
Each plane separately has a number of pixels with each pixel value varying from 0 to 255. All the three planes when combined together form a colour image. This means that in a RGB image, each pixel has a set of three different values which together give colour to that particular pixel.
For Example:

As you can see, each colour image is stored in the form of three different channels, each having different intensity. All three channels combine together to form a colour we see.
In the above given image, if we split the image into three different channels, namely Red (R), Green (G) and Blue (B), the individual layers will have the following intensity of colours of the individual pixels. These individual layers when stored in the memory looks like the image on the extreme right. The images look in the grayscale image because each pixel has a value intensity of 0 to 255 and as studied earlier, 0 is considered as black or no presence of colour and 255 means white or full presence of colour. These three individual RGB values when combined together form the colour of each pixel.
Therefore, each pixel in the RGB image has three values to form the complete colour.
Task: Go to the following link URL www.piskelapp. com and create your own pixel art. Try and make a GIF using the online app for your own pixel art.
![]()
URL (WEBSITES BASED ON IMAGE PROCESSING WITH AI TRY AND FUN)
https://emojiscavengerhunt.withgoogle.com/
https://www.w3schools.com/colours/colours_rgb.asp
https://www.piskelapp.com/
https://setosa.io/ev/image-kernels/
Image Features: In computer vision and image processing, a feature is a piece of information which is relevant for solving the computational task related to a certain application. Features may be specific structures in the image such as points, edges or objects.
For example:
Imagine that your security camera is capturing an image. At the top of the image we are given six small patches of images. Our task is to find the exact location of those image patches in the image.
Take a pencil and mark the exact location of those patches in the image.

Were you able to find the exact location of all the patches?
………………………………………………………….
………………………………………………………….
………………………………………………………….
………………………………………………………….
………………………………………………………….
………………………………………………………….
………………………………………………………….
………………………………………………………….
Which one was the most difficult to find?
………………………………………………………….
………………………………………………………….
………………………………………………………….
………………………………………………………….
………………………………………………………….
………………………………………………………….
………………………………………………………….
………………………………………………………….
Which one was the easiest to find?
………………………………………………………….
………………………………………………………….
………………………………………………………….
………………………………………………………….
………………………………………………………….
………………………………………………………….
………………………………………………………….
………………………………………………………….
Let’s Reflect: Let us take individual patches into account at once and then check the exact lecation of those patches.
For Patch A and B: The patch A and B are flat surfaces in the image and are spread over a lot of area. They can be present at any location in a given area in the image.
For Patch C and D: The patches C and D are simpler as compared to A and B. They are edges of a building and we can find an approximate location of these patches but finding the exact location is still difficult. This is because the pattern is the same everywhere along the edge.
For Patch E and F: The patches E and F are the easiest to find in the image. The reason being that E and F are some corners of the building. This is because at the corners, wherever we move this patch it will look different.
Conclusion: In image processing, we can get a lot of features from the image. It can be either a blob, an edge or a corner. These features help us to perform various tasks and then get the analysis done on the basis of the application. Now the question that arises is which of the following are good features to be used?
![]()
As you saw in the previous activity, the features having the corners are easy to find as they can be found only at a particular location in the image, whereas the edges which are spread over a line or an edge look the same all along. This tells us that the corners are always good features to extract from an image followed by the edges. Let’s look at another example to understand this. Consider the images given below and apply the concept of good features for the following.

In the above image how would we determine the exact location of each patch?
The blue patch is a flat area and difficult to find and track. Wherever you move the blue patch it looks the same. The black patch has an edge. Moved along the edge (parallel to edge), it looks the same. The red patch is a corner. Wherever you move the patch, it looks different, therefore it is unique. Hence, corners are considered to be good features in an image.
Introduction to OpenCV:
Now that we have learnt about image features and its importance in image processing, we will learn about a tool we can use to extract these features from our image for further processing.
OpenCV or Open Source Computer Vision Library is that tool which helps a computer extract these features from the images. It is used for all kinds of images and video processing and analysis: It is capable of processing images and videos to identify objects, faces, or even handwriting.
In this chapter we will use OpenCV for basic image processing operations on images such a.
s resizing, cropping and many more.
To install OpenCV library, open anaconda prompt and then write the following command:
pip install opencv-python: Now let us take a deep dive on the various functions of OpenCV to understand the various image processing techniques. Head to Jupyter Notebook for introduction to OpenCV given on this link: http://bit.ly/cv_notebook

Convolution: We have learnt that computers store images in numbers, and that pixels are arranged in a particular manner to create the picture we can recognise. These pixels have value varying from 0 to 255 and the value of the pixel determines the colour of that pixel.
But what if we edit these numbers, will it bring a change to the image? The answer is yes. As we change the values of these pixels, the image changes. This process of changing pixel values is the base of image editing.
![]()
We all use a lot of image editing software like photoshop and at the same time use apps like Instagram and snapchat, which apply filters to the image to enhance the quality of that image.

As you can see, different filters applied to an image change the pixel values evenly throughout the image. How does this happen? This is done with the help of the process of convolution and the convolution operator which is commonly used to create these effects.
Before we understand how the convolution operation works, let us try and create a theory for the convolution operator by experiencing it using an online application.
Task: Go to the link URL http://matlabtricks.com/post 5 / 3 × 3-convolution-kernels-with-online-deme and at the bottom of the page click on load Click to Load Application”
Once the application is loaded try different filters and apply it on the image. Observe how the value of the kernel is changing for different filters. Try these steps
- Change all to positive values
- Change all to negative values
Have a mixture of negative and positive values Let us follow the following steps to understand how a convolution operator works. The steps to be followed are:

Try experimenting with the following values to come up with a theory:
- Make 4 numbers negative. Keep the rest as 0.
- Now make one of them as positive.
- Observe what happens.
- Now make the second positive.
What theory do you propose for convolution on the basis of the observation?
………………………………………………………….
………………………………………………………….
………………………………………………………….
………………………………………………………….
………………………………………………………….
………………………………………………………….
………………………………………………………….
………………………………………………………….
![]()
It is time to test the theory. Change the location of the four numbers and follow the above mentioned steps. Does your theory hold true?
………………………………………………………….
………………………………………………………….
………………………………………………………….
………………………………………………………….
………………………………………………………….
………………………………………………………….
………………………………………………………….
………………………………………………………….
If yes, change the picture and try whether the theory holds true or not. If it does not hold true, modify your theory and keep trying until it satisfies all the conditions.
Let’s Discuss:
What effect did you apply?
………………………………………………………….
………………………………………………………….
………………………………………………………….
………………………………………………………….
………………………………………………………….
………………………………………………………….
………………………………………………………….
………………………………………………………….
How did different kernels affect the image?
………………………………………………………….
………………………………………………………….
………………………………………………………….
………………………………………………………….
………………………………………………………….
………………………………………………………….
………………………………………………………….
………………………………………………………….
Why do you think we apply these effects?
………………………………………………………….
………………………………………………………….
………………………………………………………….
………………………………………………………….
………………………………………………………….
………………………………………………………….
………………………………………………………….
………………………………………………………….
![]()
How do you think the convolution operator works?
………………………………………………………….
………………………………………………………….
………………………………………………………….
………………………………………………………….
………………………………………………………….
………………………………………………………….
………………………………………………………….
………………………………………………………….
Convolution : Explained
Convolution is a simple Mathematical operation which is fundamental to many common image processing operators. Convolution provides a way of ‘ multiplying together’ two arrays of numbers, generally of different sizes, but of the same dimensionality, to produce a third array of numbers of the same dimensionality. An (image) convolution is simply an element-wise multiplication of image arrays and another array called the kernel followed by sum.

As you can see here,
I = Image Array
K = Kernel Array
I * K= Resulting array after performing the convolution operator
Note: The Kernel is passed over the whole image to get the resulting array after convolution.
Convolutions are one of the most critical, fundamental building blocks in computer vision and image processing.
We learned that computers store images in numbers and that pixels are arranged in a particular manner to create the picture we can recognise. As we change the values of these pixels, the image changes.
Convolution is simply an element-wise multiplication of two matrices followed by a sum. Convolution is using a ‘kernel’ to extract certain ‘features’ from an input image.

steps of convolution:
- Take two matrices (Input Image +kernel with dimensions).
- Multiply them, element-by-element (i.e., not the dotproduct, just a simple multiplication).
- Sum the elements together.
- Then the sum will be the Centre value of the image.
What is a Kernel?
A Kernel is a matrix, which is slid across the image and multiplied with the input such that the output is enhanced in a certain desirable manner. Each kernel has a different value for different kind of effects that we want to apply to an image.
In Image processing, we use the convolution operation to extract the features from the images which can le later used for further processing especially in Convolution Neural Network (CNN), about which we will study later in the chapter.
![]()
In this process, we overlap the centre of the image with the centre of the kernel to obtain the convolution output. In the process of doing it, the output image becomes smaller as the overlapping is done at the edge row and column of the image. What if we want the output image to be of exact size of the input image, how can we achieve this?
To achieve this, we need to extend the edge values out by one in the original image while overlapping the centres and performing the convolution. This will help us keep the input and output image of the same size. While extending the edges, the pixel values are considered as zero.

Let’s try: In this section we will try performing the convolution operator on paper to understand how it works. Fill the blank places of the output images by performing the convolution operation.

Write your Output Here:

Summary:
- Convolution is a common tool used for image editing.
- It is an element wise multiplication of an image and a kernel to get the desired output.
- In computer vision application, it is used in Convolutional Neural Network (CNN) to extract image features.
Convolution Neural Network (CNN): CNN is an efficient recognition algorithm that is widely used in image recognition and processing that is specifically designed to process pixel data.

A convolutional neural network consists of the following layers:
- Convolution Layer
- Rectified linear Unit (ReLU)
- Pooling Layer
- Fully Connected Layer

Convolution Layer:
Definition: A convolutional layer is a fundamental building block of Convolutional Neural Networks (CNNs). It’s responsible for extracting key features from an input, like edges, textures, or shapes, to help the network understand and classify the data.
Imagine this: You’re showing a child a new object, like a car You point out its defining characteristics, like wheels, windows, and headlights. This is similar to what a convolutional layer does with an image. It “looks” for specific patterns and shapes (like edges and colour gradients) that act as “landmarks” for identifying the object.
![]()
Here’s how it works:
Kernel: The layer uses a small square matrix called a kernel to scan the input image. This kernel acts like a “feature detector,” searching for specific patterns.
Convolution: The kernel slides across the image, performing a dot product operation at each position. This operation essentially measures how well the kernel matches the underlying image patterns in that area.
Feature Map: The output of the convolution process is a feature map. This map contains a value for each position in the input image, indicating the strength of the detected feature at that location.
Example: Let’s say you’re training a CNN to recognise cats. The first convolutional layer might have kernels specifically tuned to detect edges, curves, and specific shapes like ears and whiskers. These kernels would “slide” over the input image, highlighting areas with these features in the resulting feature map. This information is then used by subsequent layers in the CNN to build a higher-level understanding of the image, ultimately leading to cat recognition.
In short:
- Convolutional layers extract key features from an input, like edges and patterns.
- They use kemels to scan the input and identify these features.
- The output is a feature map that highlights the detected features in the input.
- This information helps the CNN understand and classity the data.

Rectified Linear Unit (ReLU):
Definition: A type of activation function used in neural networks that sets all negative input values to zero and keeps positive values unchanged. Mathematically, its represented as f(x) = (0, x).
Example: Imagine a feature map with values like -2, 3, 1, -5. After passing through a ReLU layer, the values become 0,3,1,0.
Benefits:
- Faster training compared to other activation functions like sigmoid or tanh.
- Helps prevent vanishing gradients, a common problem in deep learning.
- Leads to sparser activations, meaning more neurons are turned off, improving computational efficiency.

If we see the two graphs side by side, the one on the left is a linear graph. This graph when passed through the ReLU layer, gives the one on the right. The ReLU graph starts with a horizontal straight line and then increases linearly as it reaches a positive number.
Now the question arises, why do we pass the feature map to the ReLU layer? it is to make the colour change more obvious and more abrupt?

As shown in the above convolved image, there is a smooth grey gradient change from black to white. After applying the ReLu function, we can see a more abrupt change in colour which makes the edges more obvious which acts as a better feature for the further layers in a CNN as it enhances the activation layer
Pooling Layer:
Definition: A layer that reduces the spatial dimensions of a feature map while preserving important features. It combines nearby activations into a single value, thereby reducing the number of parameters and computations needed in the network.
Example: Imagine a feature map with a size of 28 × 28. Applying a pooling operation with a kernel size of 2 × 2 and a stride of 2 will reduce the size to 14 × 14.
![]()
Benefits:
- Reduces the size of the network, making it faster and more efficient to train.
- Improves the network’s ability to detect features that are independent of their exact location in the input image (e.g., edges, textures).
- Provides some level of invariance to small translations and distortions in the input image.
In simpler terms:
ReLU: Acts like a filter, letting positive features pass through while discarding negative ones. Think of it like furning off a light switch for all the sbad features.
Pooling: Like shrinking a map, pooling reduces the size of the feature map while keeping the most important details. It’s like zooming out to see the bigger picture.

There are two types of pooling:
- Max pooling: The maximum pixel value of the batch is selected.
- Average pooling: The average value of all the pixels in the batch is selected.

A small difference in input image will create very similar pooled image.

Fully Connected Layer:
Definition: A fully-connected layer (FC layer) is a type of artificial neural network layer where every neuron in the layer is connected to every neuron in the nex layer. In a Convolutional Neural Network (CNN), it’s typically the final layer responsible for interpreting the extracted features and making a final decision.
Connections and weights

Example: Imagine you’re analysing a cat image in a CNN. The convolutional and pooling layers have already identified features like whiskers, fur pattern, and eye shape. The FC layer takes these features as inputs and learns complex relationships between them. If a specific combination of features (e.g., pointy ears, fluffy fur, almond eyes) consistently coincides with the “cat” label in the training data, the FC layer assigns a high probability to the image being a cat.
![]()
Essentially, the FC layer acts like a complex puzzle solver:
- Input: It receives high-level features extracted by the previous layers (like whiskers, fur).
- Connection: Each feature is connected to every “neuron” in the FC layer, allowing for complex interactions.
- Learning: The FC layer learns how these features combine and influence the final output.
- Conclusion: Based on the learned relationships, the FC layer assigns a probability to the image belonging to a specific category (e.g., “cat”).
Analogy: Think of it like baking a cake. The convolutional and pooling layers gather ingredients and prepare them (e.g., flour, eggs, sugar). The FC layer then mixes these ingredients in specific proportions (based on the recipe) and bakes them (learning the relationships). Finally, it determines the flavor and type of cake (making a conclusion).
Key Terms:
- FC layers combine high-level features extracted by CNNs.
- They learn complex relationships between features.
- They make final predictions based on these learned relationships.
- They are “cheap” in terms of computational resources compared to other methods.

Let’s Summarise:

Write the whole process of how a CNN works on the basis of the above diagram.
…………………………………………………………….
…………………………………………………………….
…………………………………………………………….
…………………………………………………………….
…………………………………………………………….
…………………………………………………………….
…………………………………………………………….
![]()
Let’s Experience:
Now let us see how this comes into practice. To see that, go to the link URL http://scs.ryerson.ca/~aharley/vis/ conv/flat.html
This is an online application of classifying different numbers. We need to analyse the different layers in the application on the basis of the CNN that we have studied in the previous section.